Catchpoint is an Internet Resilience solution offering services for retailers, Global2000, CDNs, cloud service providers, and xSPs that help increase their resilience by catching any issues in the Intenet Stack before they impact their business.
N/A
SolarWinds Engineer's Toolset
Score 9.4 out of 10
N/A
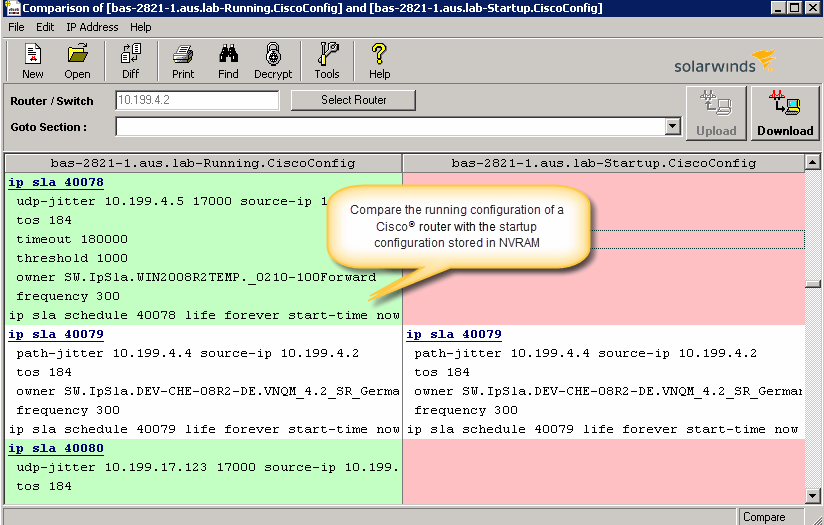
SolarWinds® Engineer’s Toolset (ETS) helps users monitor and troubleshoot a network with over 60 tools for network management. ETS allows users to monitor and receive alerts in real time on network availability and health, and perform network diagnostics for faster troubleshooting and resolution of complex
network issues. With ETS users can deploy an array of network discovery tools including Port Scanner, Switch Port Mapper or advanced Subnet Calculator, manage Cisco®
devices with specialized…
$1,585
Per Instance
Pricing
Catchpoint
SolarWinds Engineer's Toolset
Editions & Modules
No answers on this topic
One Time Price
$1,585
Per Instance
Offerings
Pricing Offerings
Catchpoint
SolarWinds Engineer's Toolset
Free Trial
Yes
Yes
Free/Freemium Version
No
No
Premium Consulting/Integration Services
No
No
Entry-level Setup Fee
No setup fee
No setup fee
Additional Details
- White glove migration services
- Annual subscription
- Professional Services
- Competitive Benchmarking
Proactive Website and API performance testing, Synthetic monitoring, and third-party integration are where Catchpoint is best suited. Catchpoint is less appropriate in Deep Application Performance monitoring, debugging complex user journeys in real-time, Small businesses, and Mobile app performance monitoring. These are the scenarios where I find Catchpoint is well-suited and scenarios where it is less appropriate.
[SolarWinds Engineer's Toolset is] a great tool for monitoring database servers, highly recommended. The very good thing is that it keeps the history for two weeks, and you can see the time slice for all the server activities. Helps a lot to identify the memory and CPU bottlenecks, research blocking issues and kill the sessions, if necessary.
Catchpoint Synthetics: We create our synthetic monitoring using catchpoint. Creating the synthetics monitors are easy and requires basic knowledge on selenium and javascript. It allows you to run the test from external(backbone) and internal enterprise nodes. The screenshot and filmstrip feature is an add-on along with various customisations. Once created, It provides a detailed insight of each request that is involved in the application flow which helps us in addressing the issue at the request level.
Catchpoint API Test: This is another kind of test which we have explored in our organisation. This has helped us to maintain the health check of our APIs and also we have utilised it for a variety of our use cases.
Catchpoint Dashboard: This is our one-stop shop for all our monitors. It has multiple widgets that displays various application performance metrics. We use this feature immensely and it is of great value to the business.
Catchpoint UI: It is very user friendly and with basic introduction anyone can just get started with it.
The ability to monitor the Catchpoint nodes with the ability to setup a take a recovery action based on specific criteria
The ability to tell us when we are at X% capacity so that we better plan or budget for increasing the "capacity" of the Catchpoint nodes before we get to an overloaded state. The capacity utilization graph is not a reliable indicator for this metric. How can the capacity utilization rate get above 100%, it does not make sense
The unifying component that is intended to be the initial interface to the tools seems clunky. I prefer to start the tools individually rather than using it.
The port scanner could use some improvements to make it easier to use.
we are heavily dependent catchpoint system for the following functions * Detect end-user availability/performance-related problems * Ensures service level objectives (SLO) are met, that prevents service level agreement (SLA) breaches * Identify and understand the cause of any network connectivity or application level issue * Improves the availability and response time service levels
It's hard to find the functionalities that I am looking for in the application. Even if I did something in the past, after a time I have to re-learn again where the functionalities are. This is a powerful tool, but not user-friendly. Texts in the buttons and menus are not always meaningful or easily comprehensible.
The customer support is fantastic as they keep you updated and follow up even though we may not even follow up. Make sure they send a communication so that we remain updated. They value engineers who will get on a call with you to understand any requirement we have on any test, and they bring in the best developers on call.
Datadog is good, but more expensive. New Relic is good but does not provide the same features as Catchpoint does. Checkly is good, but Catchpoint offers different frameworks to create synthetic tests, which is preferable to my engineering team.
These tools complement the Engineer's Toolset. They are excellent at detecting most issues and at keeping the network monitored and protected. However, when it comes time to dig into an issue, especially a hard to fix intermittent issue, these products lack the granularity of monitoring needed for these types of issues. Having said that the toolset is not made to do full time enterprise level monitoring. With these tools and the toolset I am able to have a more complete view of the network and deliver higher levels of service and quicker responses to issues.
Catchpoint points based licensing for public hosted nodes is complicated and unpredictable in points required.
Catchpoint lacks AI powered anomaly detection and automated remediation. This gap means more manual triage and slower MTTR during incidents.
The advanced 360 degree blackbox monitoring is enabling us to monitor the APIs, UI and proactively gain insights into the application behavior and performance before customer is impacted.