Cacoo is a user-friendly online diagramming tool that allows users to create a variety of diagrams such as wireframes, flowcharts, UML diagrams, network diagrams, mindmaps, sitemaps, database diagrams, and more.
Cacoo includes an extensive collection of templates and shapes, collaboration features such as simultaneous editing, version tracking, and commenting. Cacoo is simple, cloud-based software users can access from anywhere with an internet connection.
$0
Lucid Visual Collaboration Suite
Score 8.5 out of 10
N/A
The Lucid Visual Collaboration Suite empowers teams to ideate, plan, design, build, and launch game-changing solutions from a shared infinite canvas.
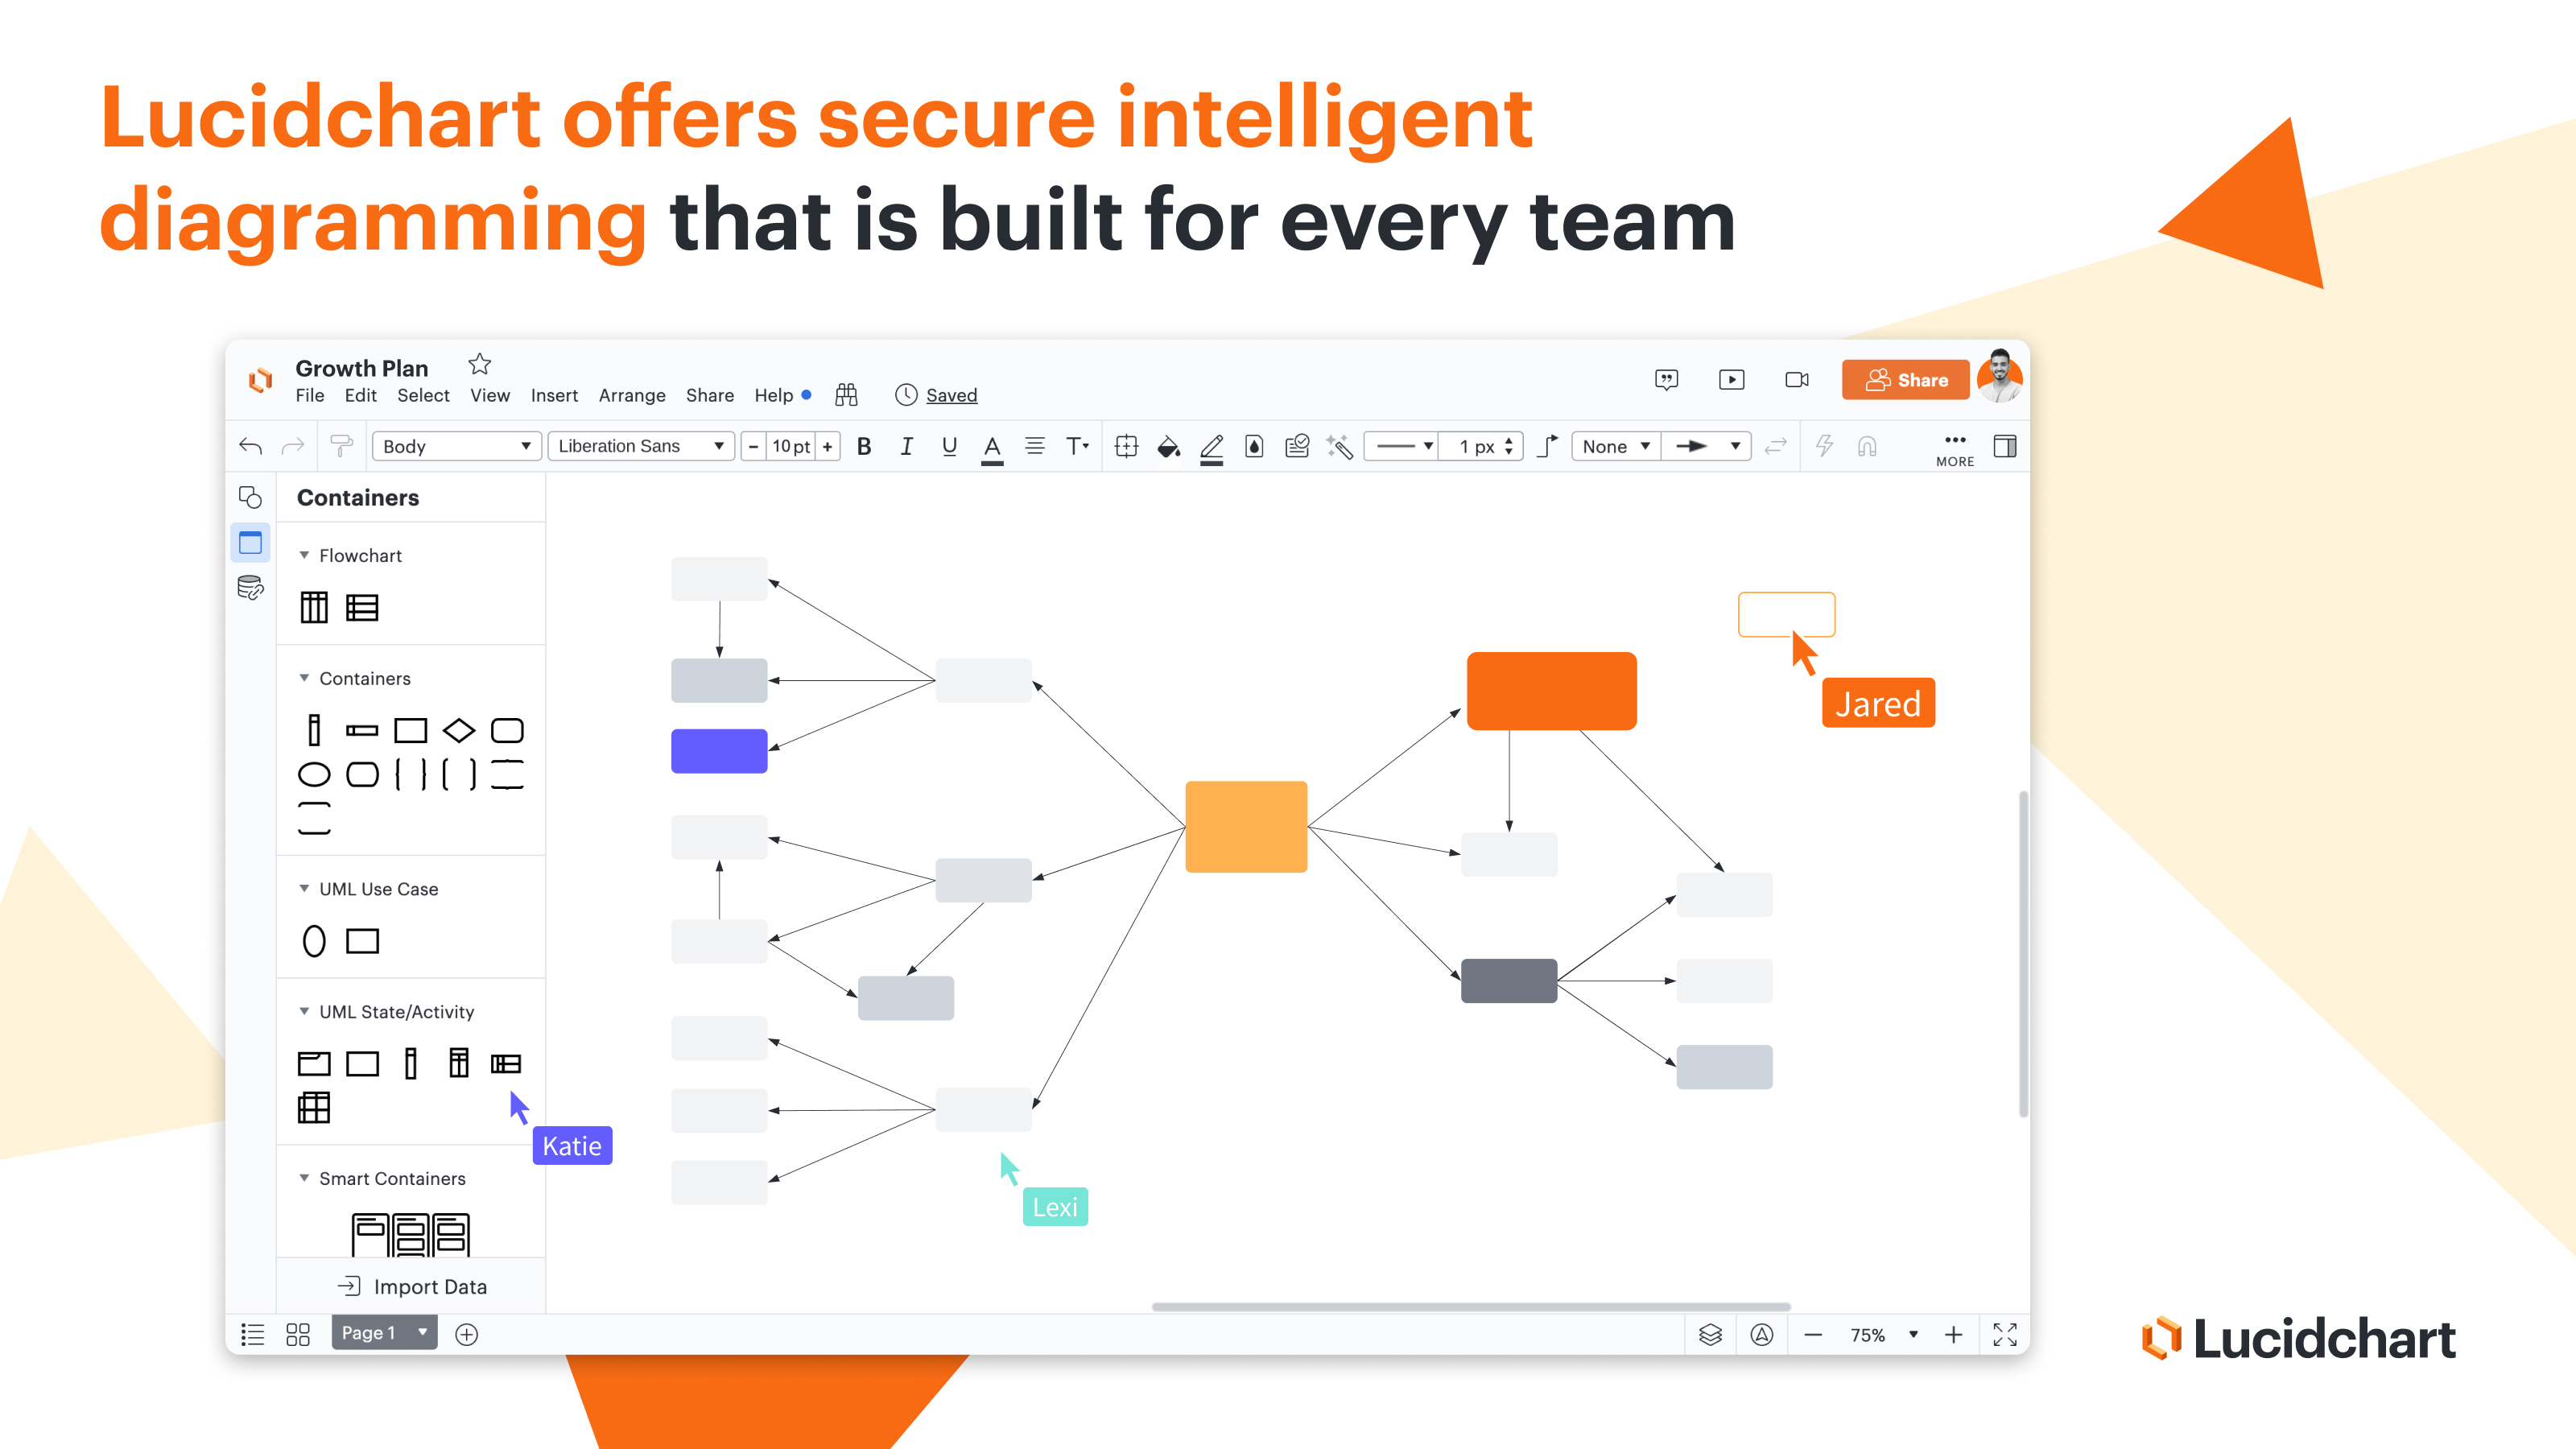
It's a great alternative to taking photos of whiteboards to save for later reference, you can just create them here. It's also the best option I've found for creating workflows and organization charts, especially complex ones. If you have just a simple workflow or chart, it's probably too robust or complicated for those needs. Save it for the trickier or messier ones!
It is hard to think of ways in which Lucid Visual Collaboration Suite would not be best suited to provide an effective tool for any organization to find success in its use. Whether it is a visual display to map an organizational structure, a collaboration to find an answer of how to improve workflow, or even to display the upcoming budget needs, working in Lucid can seamlessly provide that!
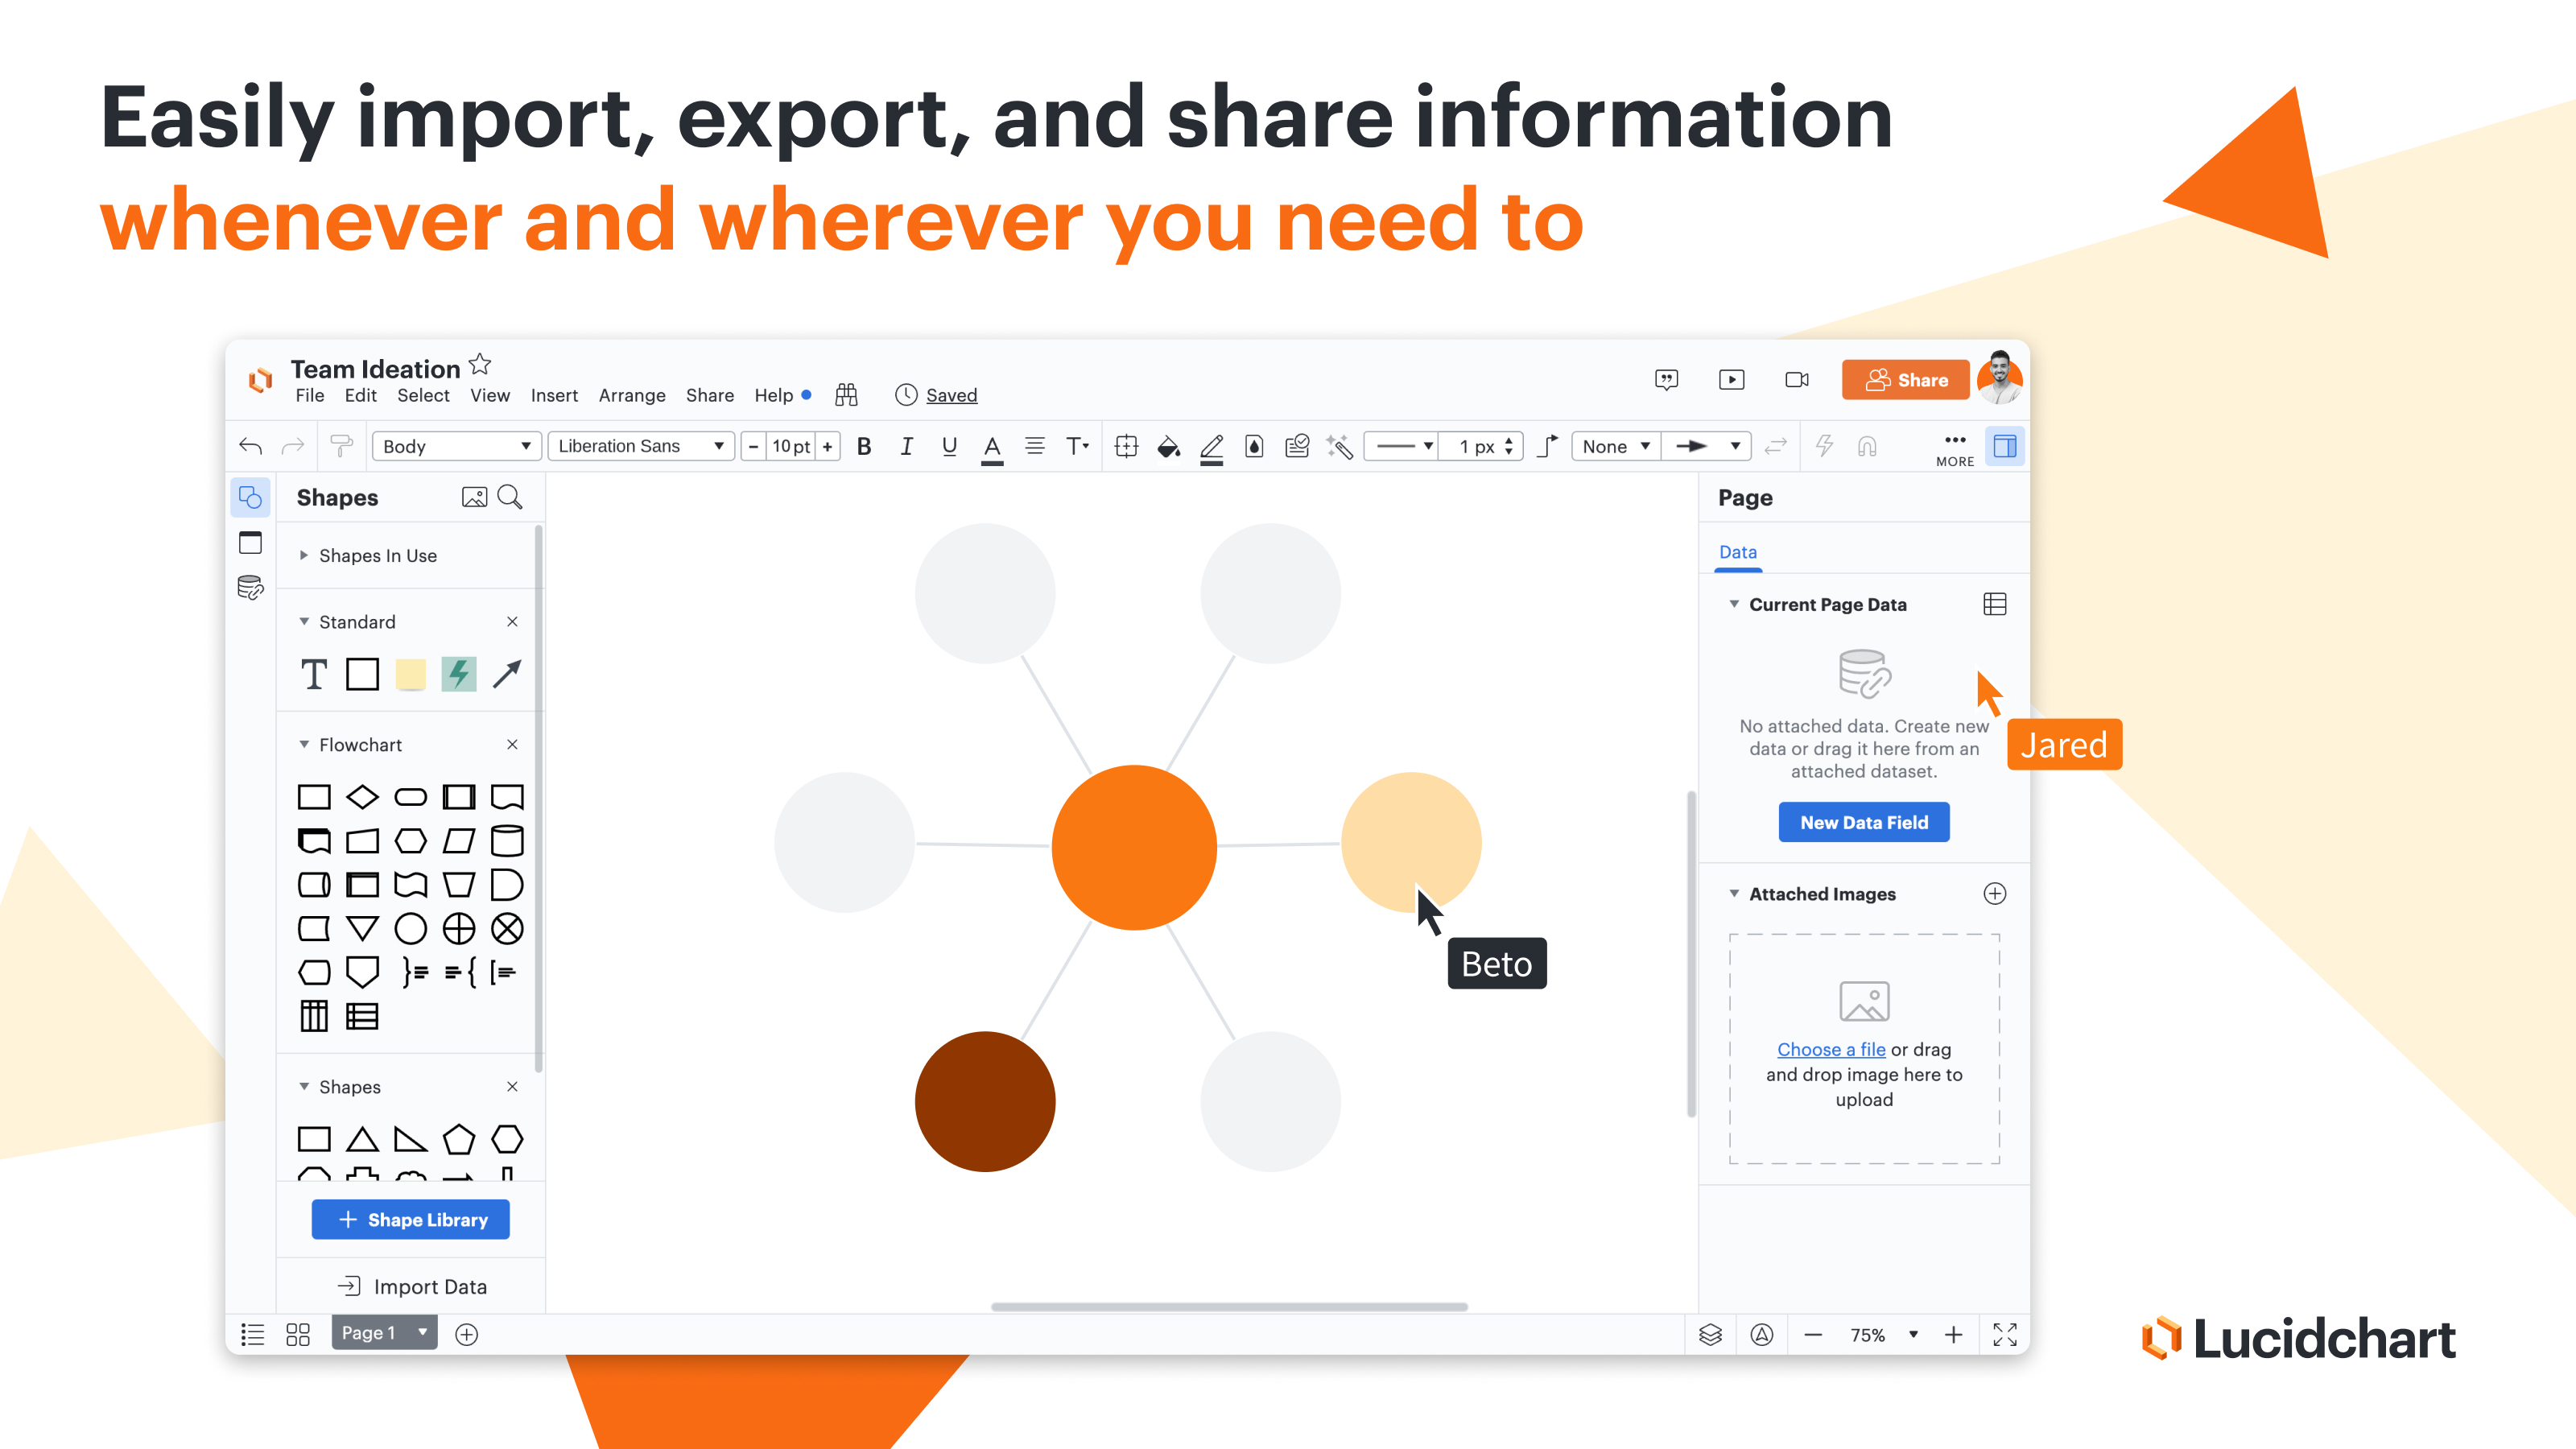
Serverless. You don't need to install another program to create diagrams, you just open a new tab and there you are, ready to go.
Collaboration. You don't need to update your colleague diagram by creating a new file and creating a new file version, you both are in the same diagram and you and all the team are free to update it at any time, at the same time, you are seeing the same thing. That is really helpful and time-saving.
Shapes. It has any shape that you can think of and Lucidchart is always updating them, I can create an Azure solution architecture, an AWS one, an old on-premise solution. Or just put standard shapes to describe a business process. Providing so many specific shapes help the diagram to express specific information, and for specific teams, that's less text and more visual information, you don't need to put a text below a standard database shape (this is an Azure SQL database), you just put the azure shape and done. That....is beautifully helpful.
The interface is easy to use and understand and most features feel very familiar from the start. There are so many features and functions that users may not know it can be done without some instruction. Lucid's champion network is a great, fun resource to learn more about the product.
I would rate the overall support for Lucidchart as a 9. The support provided is generally robust and responsive. Their help center, tutorials, and webinars offer extensive resources for users. The ticket-based support system is effective, providing timely resolutions to most issues. Moreover, they actively gather user feedback, demonstrating a commitment to continuous improvement
Cacoo is web-based and OS independent. OmniGraffle is a local install and mac only. Microsoft Visio is a desktop app also and Windows only. Two strikes for me, as I use between 2-4 different computers daily where I expect my applications to be always up-to-date and files synchronized.
Based on my personal experience, Lucid Visual Collaboration Suite is head and shoulders above any other competitor. Canva is good, but not intuitive at all. Miro is good as well, but not nearly as appealing and still lacks some of the logical functions that LucidSpark has. I’ve also used Apple FreeForm quite a bit, which is a free software with Apple. Once again you can accomplish the same things in any of these software, but Lucid Visual Collaboration Suite is so much better to the point that it is 3-4 times faster to use Lucid than Free Form or Canva.
Though I can't necessarily provide hard numbers, I can confidently say that Lucidchart has saved countless hours for myself and my teams as we don't need to try to develop some type of complex diagram using markup or any kind of code.
I have previously been able to build a complete ERD using Lucidchart in a past position, which the company never had before. It ended up being used by countless teams in the company and ultimately in a large-scale data stack migration effort.