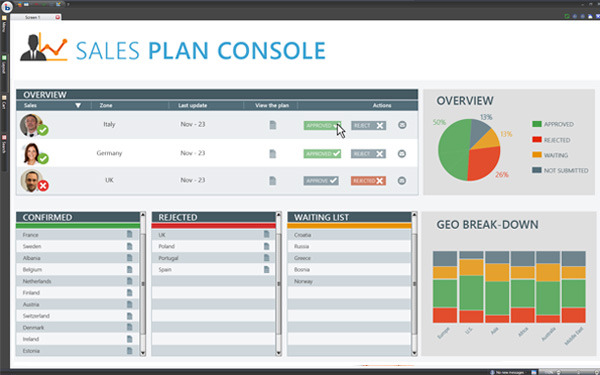
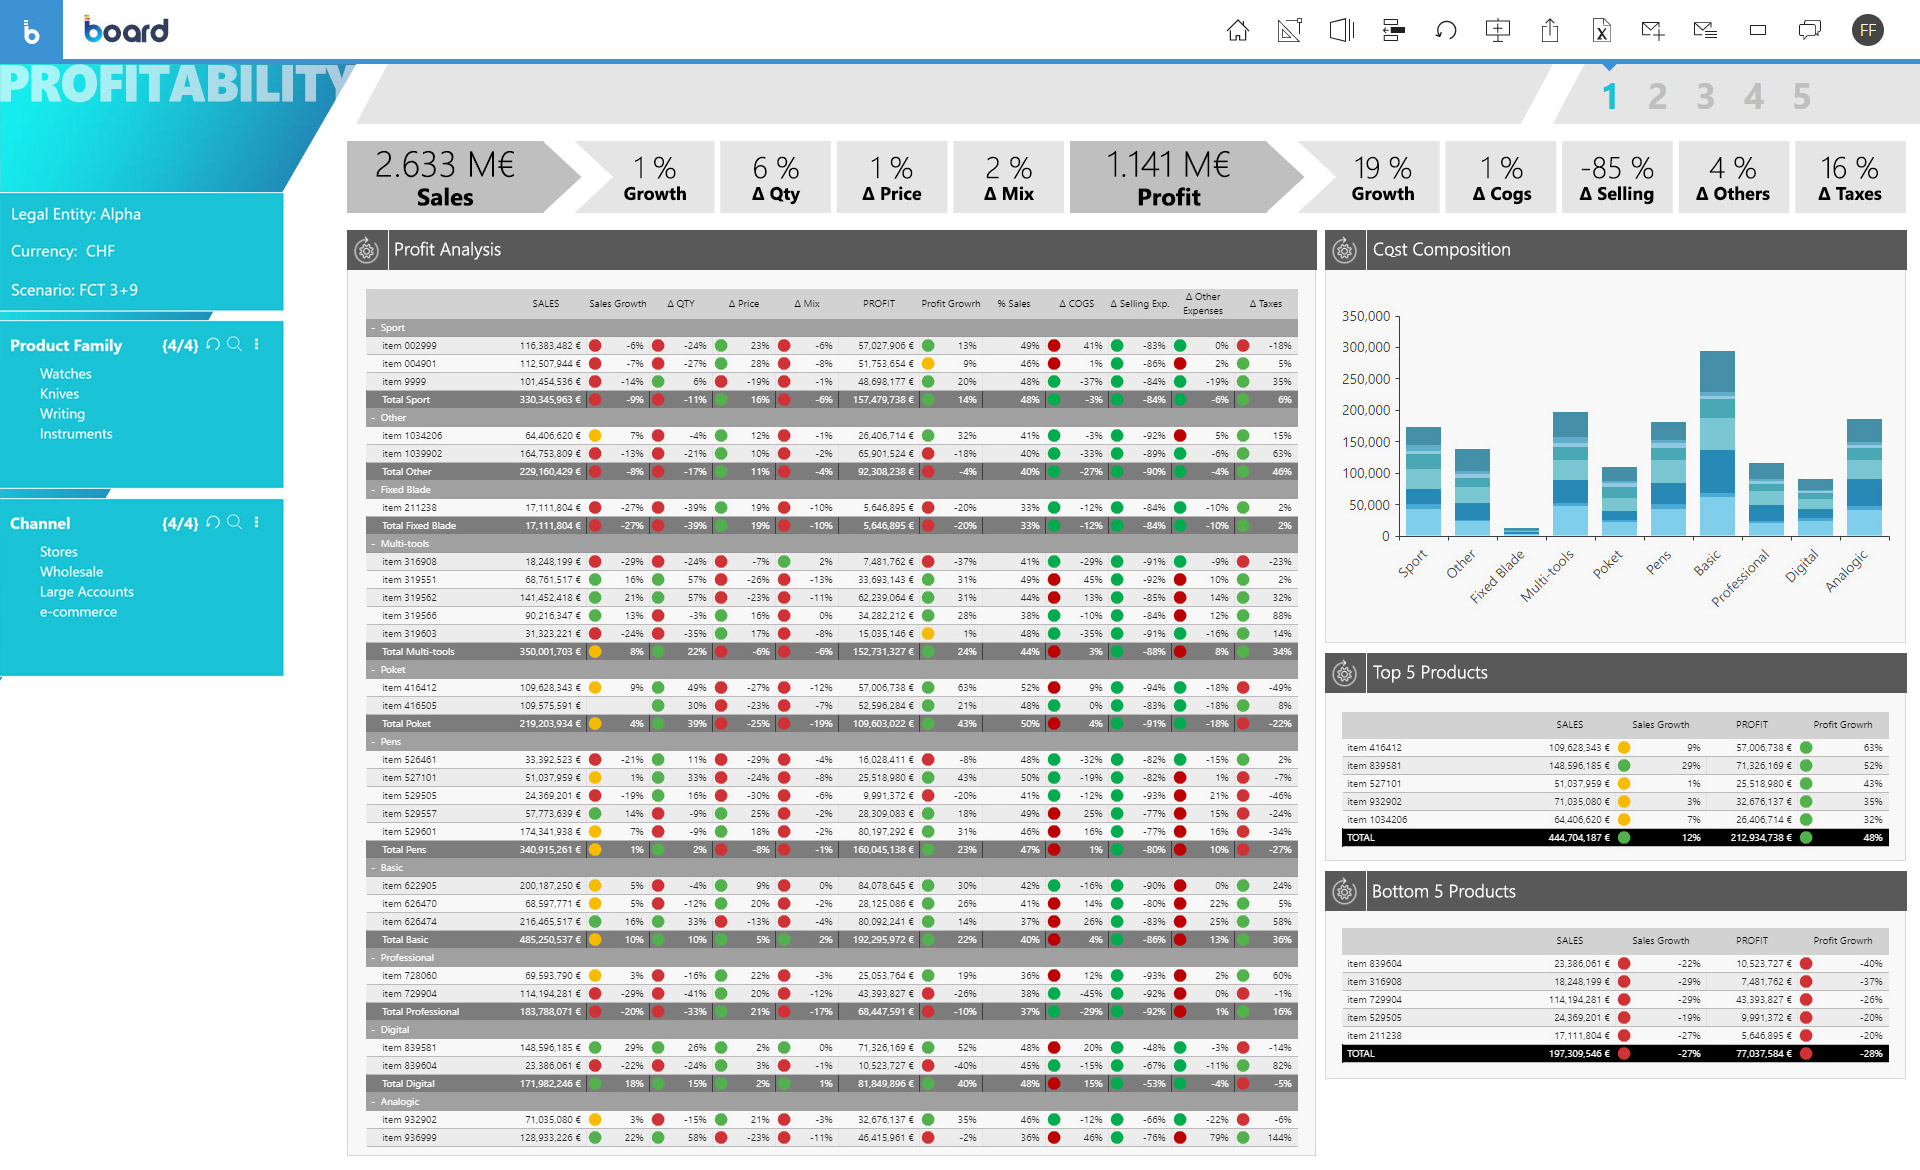
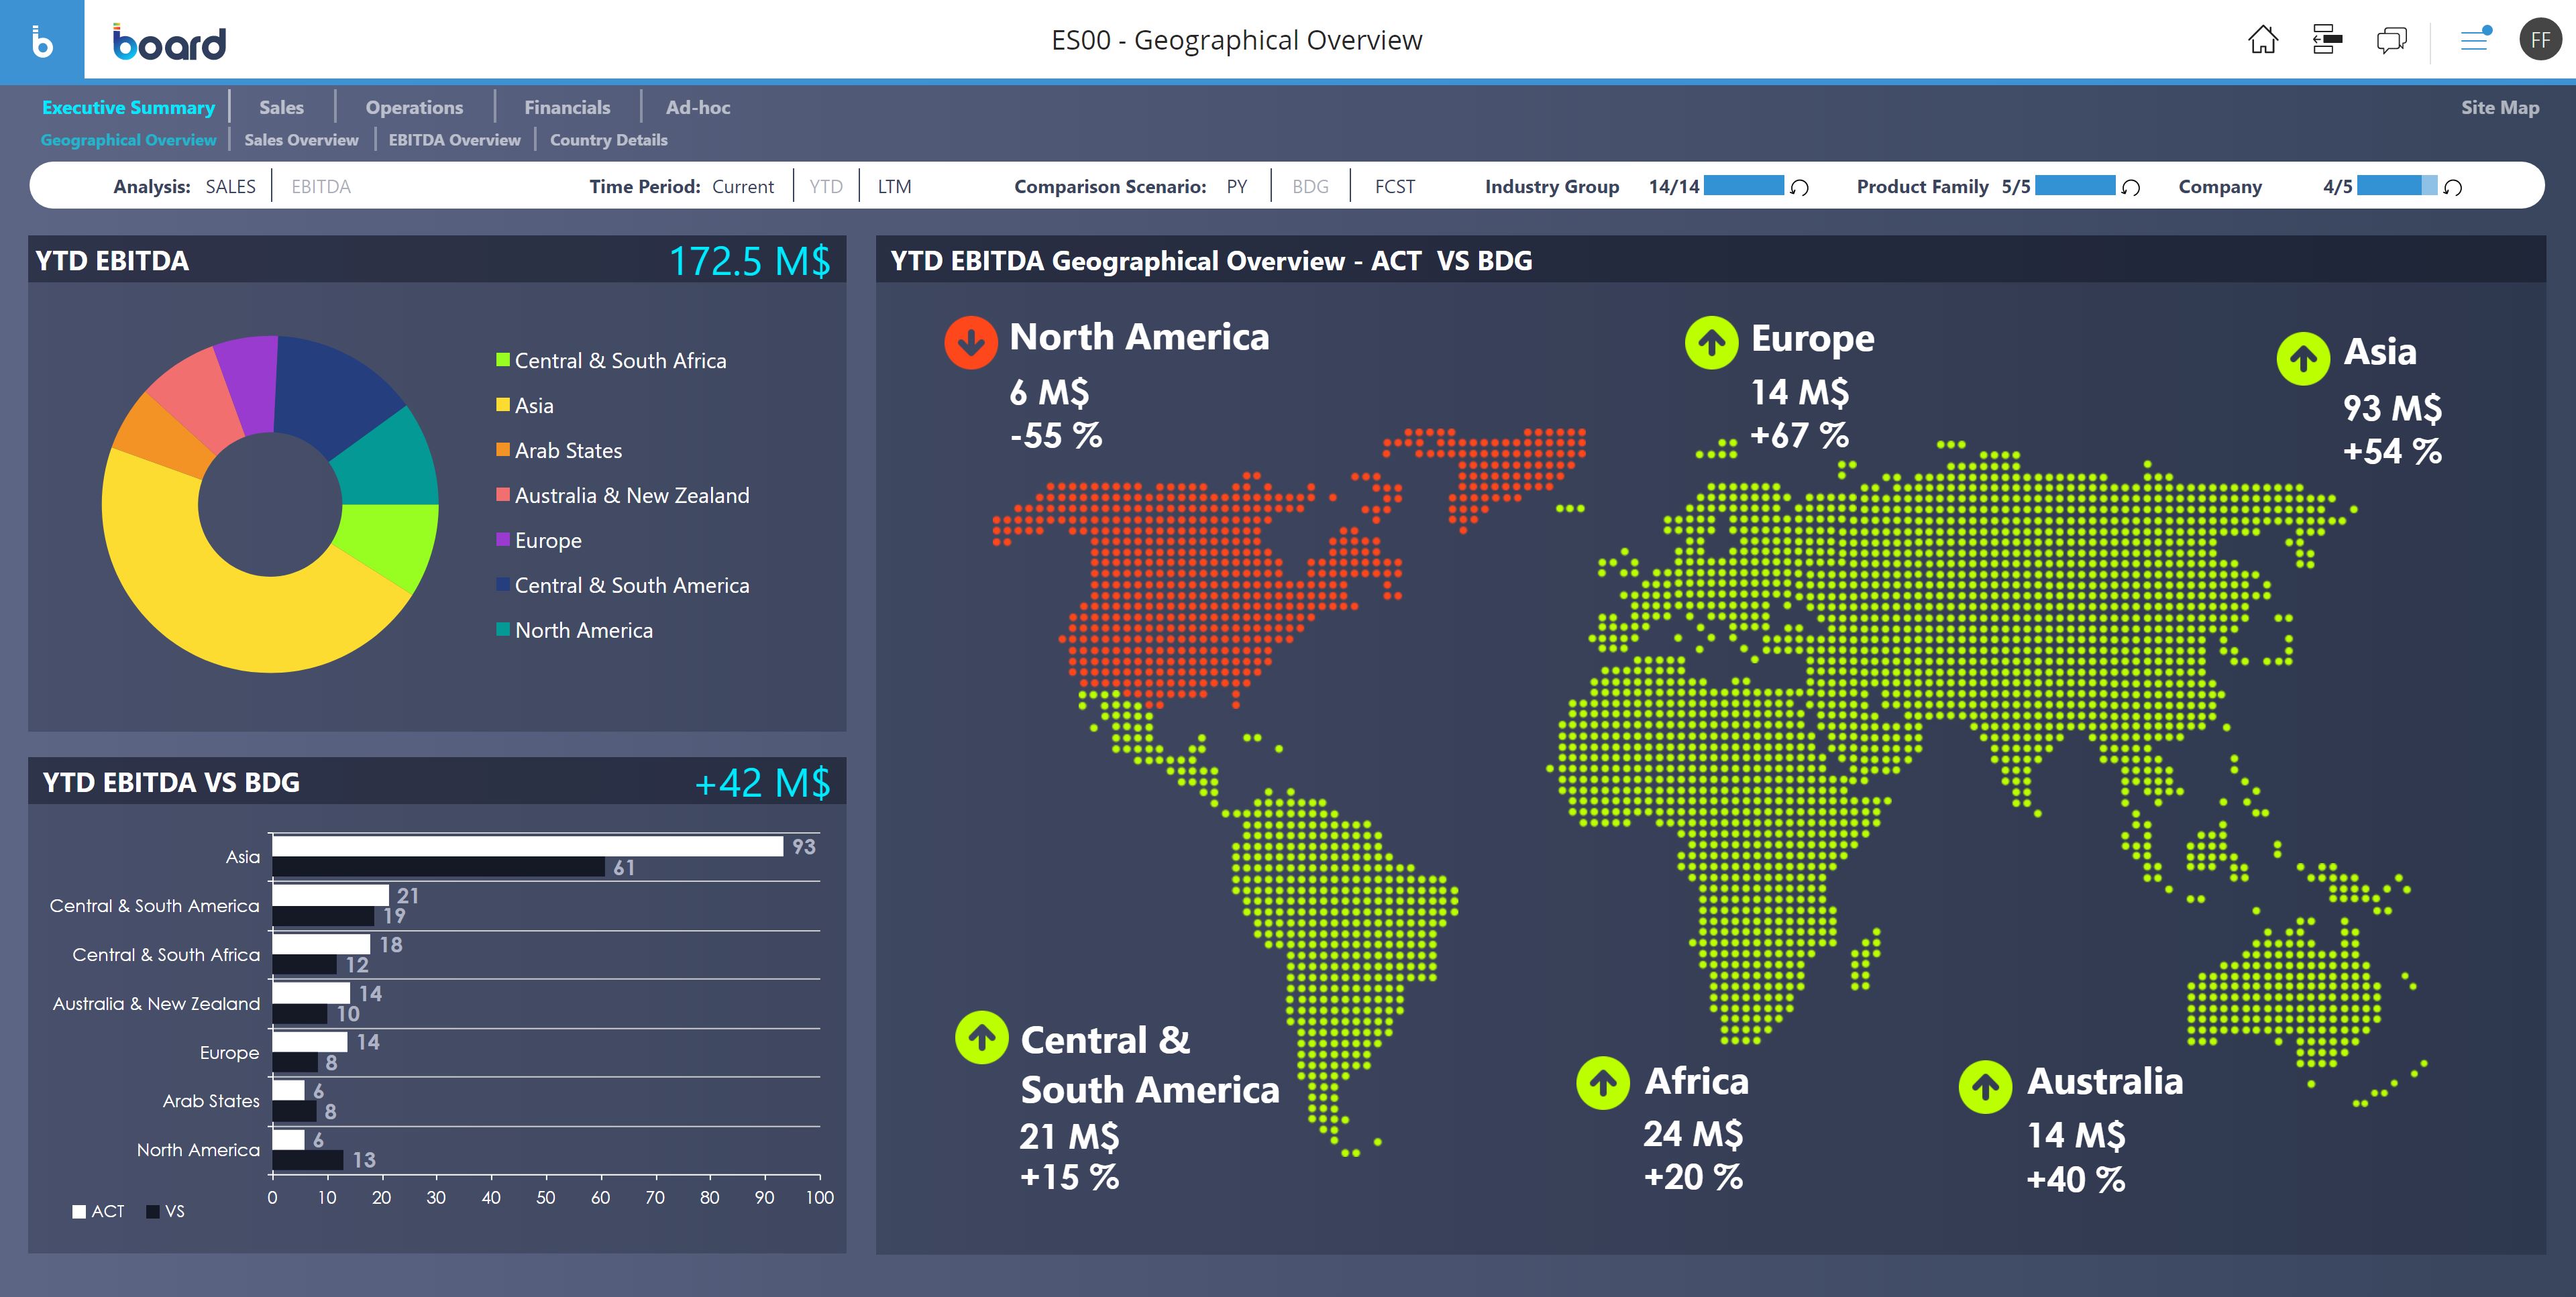
Board is presented as an enterprise planning platform, offered as a solution to accelerate business performance and enable continuous planning with greater forecast accuracy to drive confident, aligned decisions.
N/A
Cube
Score8.9 out of 10
N/A
Cube is a financial planning & analysis (FP&A) platform that aims to enable finance teams to be more strategic and positively contribute to company growth activities by spending less time on manual, repetitive task, from Cube Planning headquartered in New York.
Board is a useful tool with a great set of features. We migrated from human apps to board and we find it relatively fast in search results and better-managed threads and forums. There are some areas, such as UI and interactions which could be improved but overall a great product. The learning section is also pretty good.
1) The budget process. In QBO the budgeting capability is non-existant, unless you like manually typing in every scenario and not being able to budget by class. Cube houses my budget/forecast scenarios & lets me view and analyze by my company's preferred data points; department, GL account, vendor, & sales campaign. I'm able to run monthly budget variance reports and plan for the future with ease. 2) We've begun using Cube to help analyze profitablity by sales job. We've never had such easy access to this type of info in the past, so this is a benefit I can directly attribute to Cube. 3) We're beginning now to use an integration with our payroll software to work on headcount planning and payroll analysis.
Limited to 8 top line dimensions. Although you can bring in as many attributes of data as you want, but I would really like Cube to increase top line dimensions to 10.
The ability for cross level interaction within multiples cube would be a major plus once implemented.
Board is a fantastic product for swift BI solution delivery when compared with its peers. Ease of use, support and integration with Microsoft Office Addin open a wide horizon of opportunities for further enhancements to solutions. Easy bespoke app development capabilities make it a winner for us. BOARD is just like a white canvas, it lets you explore your creative side while designing and delivering a solution
A de minimis incentive was given to thank the reviewer for their time. The incentive was not used to bias or drive a particular response, nor was the incentive contingent on a positive endorsement. More Info
From a user perspective, Board is quite simple to use. You can evaluate the presentation of the data, the navigation, the configuration of the users, the selection of the data etc ... It would have a better rating if it were even more intuitive as regards the construction of a project, starting from the database, to the info-cubes, to entities, to data acquisition procedures from other servers.
A de minimis incentive was given to thank the reviewer for their time. The incentive was not used to bias or drive a particular response, nor was the incentive contingent on a positive endorsement. TR verified that a representative sample of customers was invited. More Info
A de minimis incentive was given to thank the reviewer for their time. The incentive was not used to bias or drive a particular response, nor was the incentive contingent on a positive endorsement. More Info
The only time I needed assistance was due to a problem in the prints: the colors of the brochures as they were on the screen were not reproduced in the print, but a series of standard colors were reproduced. This fact made colored numbers on a colored background illegible. From the assistance they confirmed that it was a problem of version 10.2 that occurred when leaving the brochures with the default colors proposed by Board. To obtain the desired colors, they had to be personalized ... I didn't like the solution very much and the technician who recommended it didn't like me either, but they would have solved the problem with the following versions. In any case, the assistance was quick and effective even if not exactly efficient.
A de minimis incentive was given to thank the reviewer for their time. The incentive was not used to bias or drive a particular response, nor was the incentive contingent on a positive endorsement. TR verified that a representative sample of customers was invited. More Info
Board is fairly simple and straight forward. Advance training on workflows and procedures is a good one but the training content only touches through the interesting areas. training content needs to cover a few areas more in-depth
A de minimis incentive was given to thank the reviewer for their time. The incentive was not used to bias or drive a particular response, nor was the incentive contingent on a positive endorsement. More Info
The problem of user profiling in our context is certainly quite complex. The complexity is given by the fact that the company is divided territorially into logistic points of sale, but at the same time they are virtually divided into divisions (or specific implementation areas) and points of sale of competence. The same operator can have access to data at different logistic sales points, sales points of competence and divisions.
A de minimis incentive was given to thank the reviewer for their time. The incentive was not used to bias or drive a particular response, nor was the incentive contingent on a positive endorsement. TR verified that a representative sample of customers was invited. More Info
Board has been more complete when compared to Anaplan. Although I didn't participate in the buying decision of any of those products I have used both and by far Board just has more features. It's more than a CPM, it's BI and CPM put together. If I had to make a choice now it would be Board.
Cube was just a lot easier to use than Vena. We took some time to look at Vena as well and while their product was impressive, our organization was not yet there. We needed something we could implement quickly, and in today's day and age I think that is a very important quality to have. Start up and early stage companies do not have the luxury of implementation teams and massive IT resources so Cube was a huge help.
A de minimis incentive was given to thank the reviewer for their time. The incentive was not used to bias or drive a particular response, nor was the incentive contingent on a positive endorsement. More Info
Board facilitates proactive decision making - it gives all the insights of the company's needs, which includes predictive analytics and manipulation of data to make different types of reports.
Easy to use for non-programmer and integration with other software is seamless. It has [the] ability to handle large amounts of data.
A de minimis incentive was given to thank the reviewer for their time. The incentive was not used to bias or drive a particular response, nor was the incentive contingent on a positive endorsement. More Info
A de minimis incentive was given to thank the reviewer for their time. The incentive was not used to bias or drive a particular response, nor was the incentive contingent on a positive endorsement. More Info