
Chartio (discontinued) vs. Supermetrics
| Product | Rating | Most Used By | Product Summary | Starting Price |
|---|---|---|---|---|
 Chartio (discontinued) | Score7.5 out of 10 | N/A | Chartio is a visualization tool designed to enable anyone to explore, transform and visualize data on the fly through a drag-and-drop interface. Chartio was acquired by Atlassian in February 2021 so that it's capabilities could be integrated into the Atlassian product portfolio's capabilities. Chartio is no longer available to new customers, standalone. Existing customers must migrate to alternatives by March 2022, when the service will be retired. | $40 per user/per month |
 Supermetrics | Score10 out of 10 | N/A | Supermetrics, from the company of the same name in Helsinki, offers an application which automates integration of data from multiple online advertising platforms (e.g. Facebook, Google Analytics and Adwords, Bing, etc) and supports customizable presentations and visualizations of the aggregated data to make cross-platform comparisons and summaries easier for marketers. | $29 per month |
| Chartio (discontinued) | Supermetrics | |||||||||||||||
|---|---|---|---|---|---|---|---|---|---|---|---|---|---|---|---|---|
| Editions & Modules |
|
| ||||||||||||||
| Offerings |
| |||||||||||||||
| Entry-level Setup Fee | No setup fee | No setup fee | ||||||||||||||
| Additional Details | — | In addition to the basic licensing tiers, Supermetrics offers customized packages according to customer needs. | ||||||||||||||
| More Pricing Information | ||||||||||||||||
| Chartio (discontinued) | Supermetrics | |
|---|---|---|
| Considered Both Products | No answer on this topic | No answer on this topic |
| Key User Insights | ||
| Would buy again | ||
No answers on this topic | 100% Would buy again 10 Answers | |
| Delivers good value for the price | ||
No answers on this topic | 100% Delivers good value for the price 9 Answers | |
| Happy with the feature set | ||
No answers on this topic | 100% Happy with the feature set 10 Answers | |
| Lived up to sales and marketing promises | ||
No answers on this topic | 100% Lived up to sales and marketing promises 9 Answers | |
| Implementation went as expected | ||
No answers on this topic | 100% Implementation went as expected 10 Answers | |
| Chartio (discontinued) | Supermetrics | ||||||||||||||||
|---|---|---|---|---|---|---|---|---|---|---|---|---|---|---|---|---|---|
| BI Standard Reporting |
| ||||||||||||||||
| Ad-hoc Reporting |
| ||||||||||||||||
| Report Output and Scheduling |
| ||||||||||||||||
| Data Discovery and Visualization |
| ||||||||||||||||
| Chartio (discontinued) | Supermetrics | |
|---|---|---|
| Small Businesses |  Looker Studio Score7.6 out of 10 |  Agency Analytics Score9.9 out of 10 |
| Medium-sized Companies |  Jet Reports Score9.5 out of 10 |  TrackMaven Score8.5 out of 10 |
| Enterprises |  Grafana Score8.7 out of 10 | TrackMaven Score8.5 out of 10 |
| All Alternatives | View all alternatives | View all alternatives |
| Chartio (discontinued) | Supermetrics | |
|---|---|---|
| Likelihood to Recommend | 8.0 | 10.0 |
| Likelihood to Renew | 8.0 | - |
| Usability | 7.6 | - |
| Availability | 8.6 | - |
| Performance | 7.3 | - |
| Online Training | 8.2 | - |
| Implementation Rating | 7.3 | - |
| Data Sharing and Collaboration | 5.0 | - |
| Data Sources | 6.9 | - |
| Product Scalability | 6.8 | - |
| Chartio (discontinued) | Supermetrics | |
|---|---|---|
| Likelihood to Recommend |
|
|
| Pros |
|
|
| Cons |
|
|
| Likelihood to Renew |
| No answers on this topic |
| Usability |
| No answers on this topic |
| Online Training |
| No answers on this topic |
| Alternatives Considered |
|
|
| Scalability |
| No answers on this topic |
| Return on Investment | No answers on this topic |
|
| ScreenShots | Chartio (discontinued) Screenshots 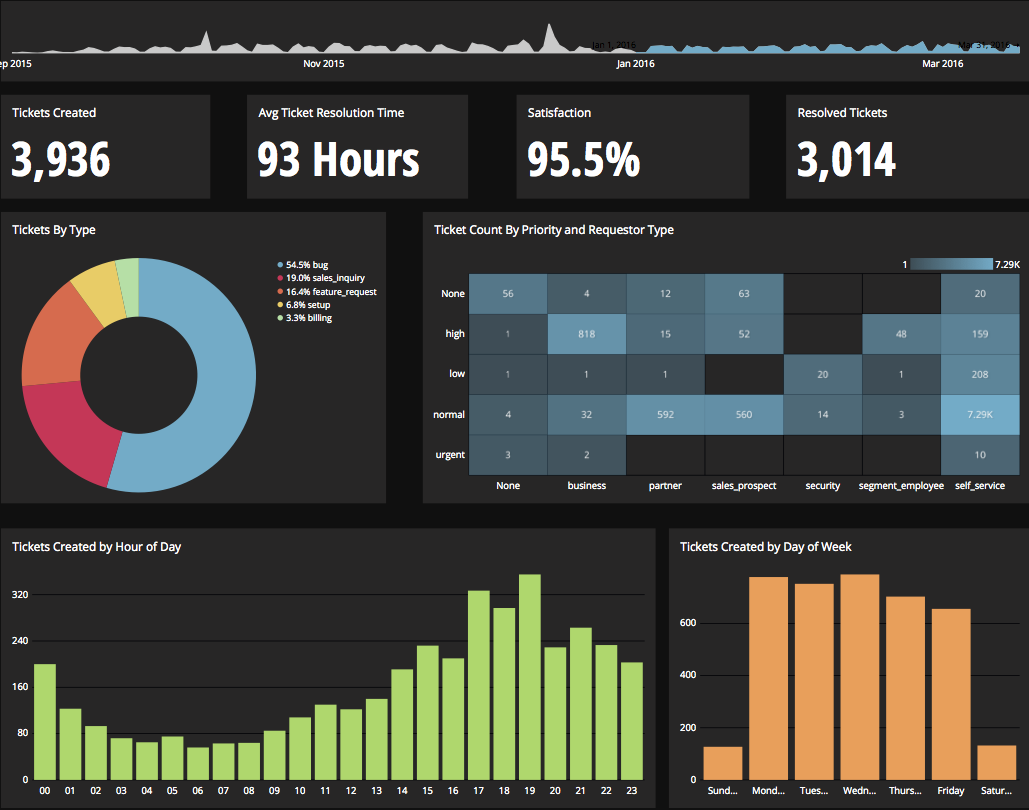     | Supermetrics Screenshots     |


