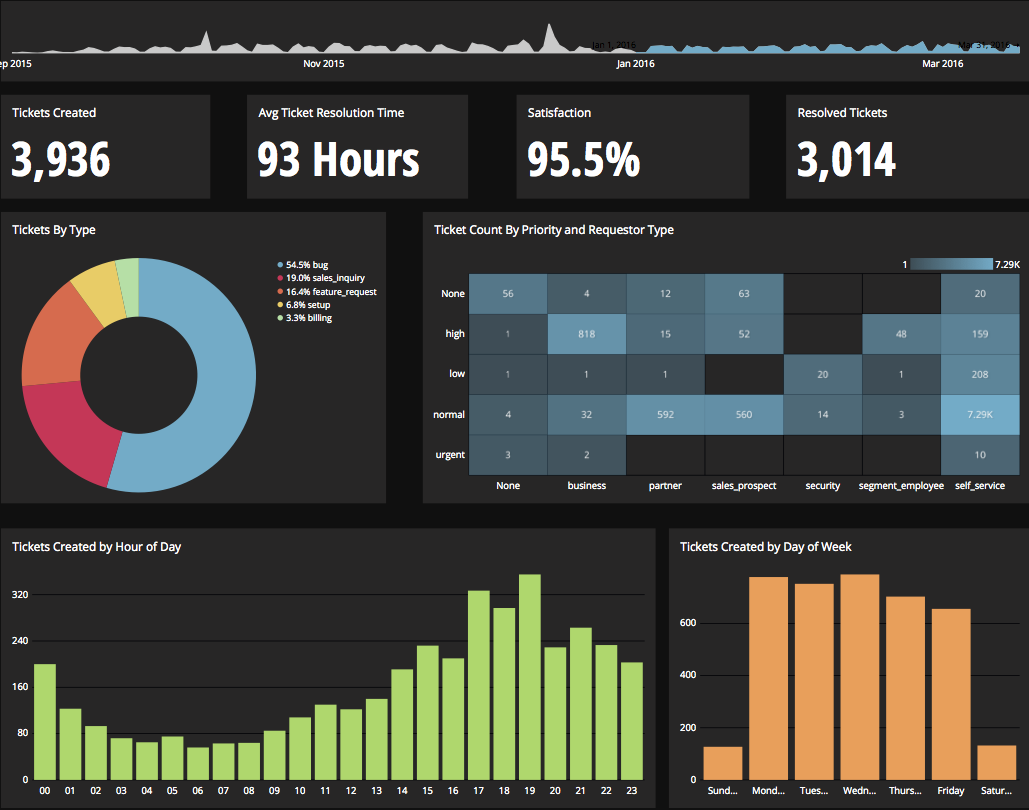
Chartio is a visualization tool designed to enable anyone to explore, transform and visualize data on the fly through a drag-and-drop interface. Chartio was acquired by Atlassian in February 2021 so that it's capabilities could be integrated into the Atlassian product portfolio's capabilities. Chartio is no longer available to new customers, standalone. Existing customers must migrate to alternatives by March 2022, when the service will be retired.
$40
per user/per month
Sigma
Score9.1 out of 10
N/A
Sigma Computing headquartered in San Francisco provides a suite of data services such as code free data modeling, data search and explorating, and related BI and data visualization services.
N/A
Pricing
Chartio (discontinued)
Sigma
Editions & Modules
Starter
$40
per user/per month
Professional
$60
per user/per month
Organization
Contact sales team
No answers on this topic
Offerings
Pricing Offerings
Chartio (discontinued)
Sigma
Free Trial
Yes
Yes
Free/Freemium Version
No
No
Premium Consulting/Integration Services
Yes
No
Entry-level Setup Fee
No setup fee
Optional
Additional Details
—
Contact us for pricing.
More Pricing Information
Community Pulse
Chartio (discontinued)
Sigma
Considered Both Products
Atlassian
No answer on this topic
Sigma Computing
Verified User
Chose Sigma
I was not involved in the decision-making process, and we stopped using chartio because it was discontinued. Chartio was great for looking under the hood at individual queries. Sigma is superior in the visualization aspects - it looks more professional and clean-cut. I've …
A de minimis incentive was given to thank the reviewer for their time. The incentive was not used to bias or drive a particular response, nor was the incentive contingent on a positive endorsement. More Info
Verified User
Chose Sigma
We have more reports and more flexibility so that helps with making decisions. We have also found more reports to use and data to analyze because of the flexibility. The only bad thing is the downtime and the slowness of reports that are bigger. Chartio cached data so it was …
A de minimis incentive was given to thank the reviewer for their time. The incentive was not used to bias or drive a particular response, nor was the incentive contingent on a positive endorsement. More Info
Verified User
Chose Sigma
We migrated to Sigma after using Chartio for about 5 years. In almost every way Sigma has been an upgrade on Chartio, most notably in its ability to handle large tables. We selected Sigma because we wanted to shift some of the data analysis to less technical team members, and …
A de minimis incentive was given to thank the reviewer for their time. The incentive was not used to bias or drive a particular response, nor was the incentive contingent on a positive endorsement. More Info
A de minimis incentive was given to thank the reviewer for their time. The incentive was not used to bias or drive a particular response, nor was the incentive contingent on a positive endorsement. More Info
A de minimis incentive was given to thank the reviewer for their time. The incentive was not used to bias or drive a particular response, nor was the incentive contingent on a positive endorsement. More Info
Verified User
Chose Sigma
I was not involved in the decision to migrate from using Chartio to Sigma. That being said, I think that Sigma compares favorably to Chartio. The thing that I liked more about Chartio is that the appearance of the dashboard had more functionality. You could drag/drop charts …
A de minimis incentive was given to thank the reviewer for their time. The incentive was not used to bias or drive a particular response, nor was the incentive contingent on a positive endorsement. More Info
A de minimis incentive was given to thank the reviewer for their time. The incentive was not used to bias or drive a particular response, nor was the incentive contingent on a positive endorsement. More Info
Verified User
Chose Sigma
Sigma has the best pricing model for a company between 50 and 200 employees. It also has the best data exploration toolkit for non-SQL users. Both of these were the key selling points that set Sigma apart from competitors. Sigma also integrates seamlessly with Snowflake and is …
A de minimis incentive was given to thank the reviewer for their time. The incentive was not used to bias or drive a particular response, nor was the incentive contingent on a positive endorsement. More Info
Chartio is a great tool for building presentable dashboards. It can export, you can add read-only access, and it has permissions levels by dashboard for users. There are other data analysis tools that help to analyze the data, but few allow for such a nice presentation
We were able to set up client-facing embedded reports with ease and security. The interface is not difficult to learn, although we may not be aware of or lack the necessary expertise to utilize more advanced features that would likely benefit us.
A de minimis incentive was given to thank the reviewer for their time. The incentive was not used to bias or drive a particular response, nor was the incentive contingent on a positive endorsement. More Info
Direct linkage to our databases. Abstracts away the visualization layer so we can focus on the data and the queries.
Host of graphs and tools that permits all types of data visualizations.
Haven't quite used this yet, but there is a new embedding feature that will be very helpful so that we can embed the charts into a company central dash.
A de minimis incentive was given to thank the reviewer for their time. The incentive was not used to bias or drive a particular response, nor was the incentive contingent on a positive endorsement. More Info
There is not a last full month date range option. You can still get the range that you need, but the dashboards will have to be manually updated to exclusively display one whole month.
When building a chart, the area which displays your tables and fields is finite. You can't adjust the size to make it easier to see. They do allow a mouse-over to see the entire name of your table/field, but I would prefer to adjust the width.
Once you modify a query in the Custom Query tab, there doesn't seem to be a way to go back to using the U.I.
Sigma Computing does not allow custom ordering of pivot fields in pivot tables easily
Sigma Computing lacks functionality for creating tables or sections that dynamically adjust to the browser window's height while maintaining a fixed height textbox at the bottom
Sigma Computing does not provide straightforward options for formatting totals in tables, such as renaming 'Total' to 'Average', 'Team Total', etc
Sigma Computing does not support searching by individual tab names within a workbook
A de minimis incentive was given to thank the reviewer for their time. The incentive was not used to bias or drive a particular response, nor was the incentive contingent on a positive endorsement. More Info
Great customer support: You will receive an answer by email usually within 20-30 minutes. Not only that but our CSMs for Chartio go out of their way to help, they have even created charts for some of the less experienced users that wanted an example to work from. We have had nothing but great experiences with this team.
A de minimis incentive was given to thank the reviewer for their time. The incentive was not used to bias or drive a particular response, nor was the incentive contingent on a positive endorsement. More Info
Sigma has helped us a lot and has become an integral part of our daily workflow. It would be difficult to switch to another platform and have to rebuild the numerous metrics and performance reports that we have already established
A de minimis incentive was given to thank the reviewer for their time. The incentive was not used to bias or drive a particular response, nor was the incentive contingent on a positive endorsement. More Info
I really like using Chartio. I use it on a daily basis for pulling data from different sources and combining data (the explore tab was a great idea for this use). I think I would give it 8/10 because there needs to be more documentation or maybe blog posts about things people are doing with it. I only have my own ideas about what to do /how to graph things. I know there are some articles, but it would be awesome to have a section on the neat dashboards people are building or how they show data in different ways. Another complaint is how much time it takes to load. I know our databases aren't set up precisely for Chartio and I have been creating data stores. But the data stores have so many more limitations that adds a whole new layer of frustration. Love the product, keep up the good work and the fast fixes.
It has a clean and modern interface. However, it is not completely intuitive. I think it would be better and easier to navigate with more Windows style drop down menus and/or tabls. There is a significant learning curve, but that may be due in part to the technical nature of this type of software tool.
A de minimis incentive was given to thank the reviewer for their time. The incentive was not used to bias or drive a particular response, nor was the incentive contingent on a positive endorsement. More Info
A de minimis incentive was given to thank the reviewer for their time. The incentive was not used to bias or drive a particular response, nor was the incentive contingent on a positive endorsement. More Info
A de minimis incentive was given to thank the reviewer for their time. The incentive was not used to bias or drive a particular response, nor was the incentive contingent on a positive endorsement. More Info
They are very friendly and informative. They are quick in resolving our queries and help us understand very minute things as well. They are quick in creating feature tickets based on our custom requirements, and they would also create a bug ticket if there is any discrepancy and get that checked on time.
A de minimis incentive was given to thank the reviewer for their time. The incentive was not used to bias or drive a particular response, nor was the incentive contingent on a positive endorsement. More Info
I use self learning materials. Pretty helpful. I find myself having to go back to the "drilldown" instructions though, and have a hard time finding hidden variables on a dashboard, so perhaps there is room for intuitive improvements (or maybe I'm just being lazy)
A de minimis incentive was given to thank the reviewer for their time. The incentive was not used to bias or drive a particular response, nor was the incentive contingent on a positive endorsement. More Info
Chartio so far has been the easiest BI tool to setup and has also been the most affordable. There are some other, great, BI tools out there but they were a bit to heavy handed for what we needed. Also - despite the high cost per user in Chartio, the other tools were still more expensive.
A de minimis incentive was given to thank the reviewer for their time. The incentive was not used to bias or drive a particular response, nor was the incentive contingent on a positive endorsement. More Info
With Looker, to be effective, a substantial amount of coding & modeling needs to happen in LookML. Being another language to learn, users have to context switch again from at a minimum either SQL or Python into LookML. The concept of being able to source control, code review, and deploy your models is a plus though.
Tableau is the gold standard for data visualization, no question. Power users will be able to create dazzling content that Sigma won't necessarily be able to easily match. However, since development usually happens via an extract, helping other users troubleshoot is an arduous process. Trying to re-do or un-do all the transformations and calculations that cause a certain number is very difficult.
With Sigma, all the queries happen directly against Snowflake and you can see the query logs. The data modeling happens right in a tabular, spreadsheet-like manner, so within only a few minutes, substantial transformations can happen, with visualizations just a few more clicks away.
Chartio has worked well as our datawarehouse has rapidly expanded, and the usability/performance hasn't seemed to have suffered. What we haven't yet realized is additional savings from additional users. We have some dashboard needs for users who truly just view of a few charts, and the licensing structure hasn't yet been structured in a way that would support that type of approach...having 50 "core" licenses, and then potentially several hundred view only licenses for partners that would use the application infrequently.
A de minimis incentive was given to thank the reviewer for their time. The incentive was not used to bias or drive a particular response, nor was the incentive contingent on a positive endorsement. More Info
Monitoring health of cloud platform has allowed the company to anticipate issues before they affect customers – Sigma prompted us building a canary monitoring process that provides customer container health.
Customer success has used an activity report to discover customers running runaway processes that they were unaware of, creating an alert to contact the customer and prevent an embarrassing situation.
Customer success uses the activity report to prompt conversations regarding increases or declines in behavior that led to increasing contract limits or addressing churn concerns.
A de minimis incentive was given to thank the reviewer for their time. The incentive was not used to bias or drive a particular response, nor was the incentive contingent on a positive endorsement. More Info