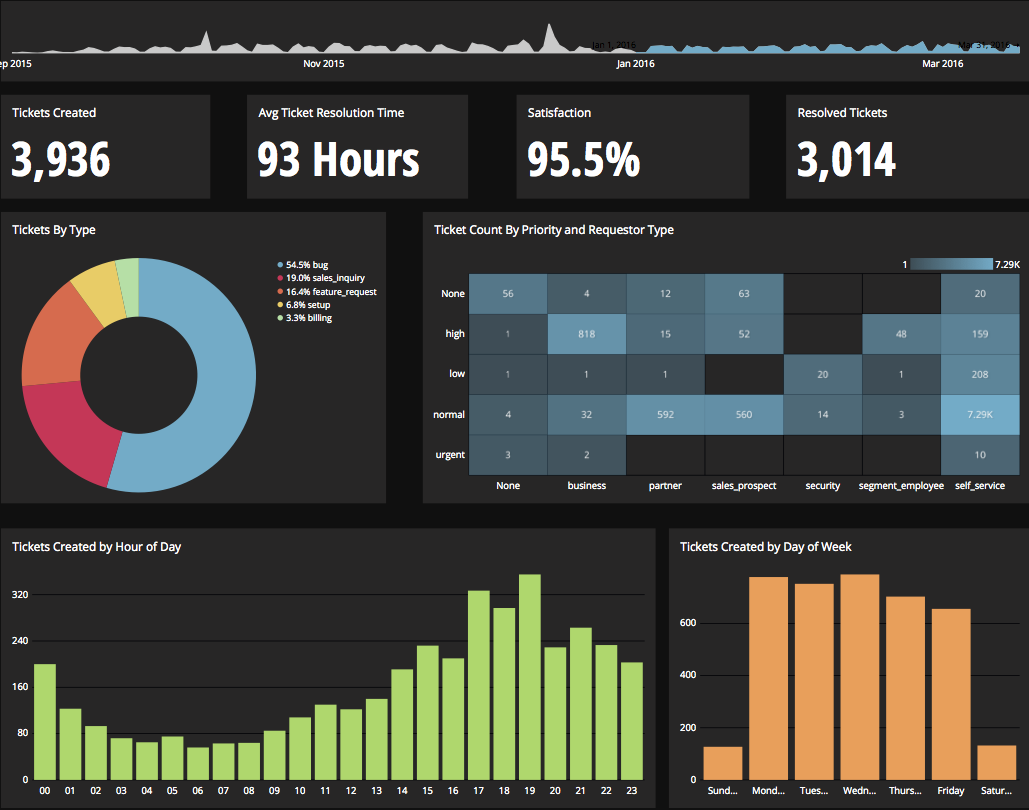
Chartio is a visualization tool designed to enable anyone to explore, transform and visualize data on the fly through a drag-and-drop interface. Chartio was acquired by Atlassian in February 2021 so that it's capabilities could be integrated into the Atlassian product portfolio's capabilities. Chartio is no longer available to new customers, standalone. Existing customers must migrate to alternatives by March 2022, when the service will be retired.
$40
per user/per month
Looker
Score8.5 out of 10
N/A
Looker is a BI application with an analytics-oriented application server that sits on top of relational data stores. It includes an end-user interface for exploring data, a reusable development paradigm for data discovery, and an API for supporting data in other systems.
N/A
Pricing
Chartio (discontinued)
Looker
Editions & Modules
Starter
$40
per user/per month
Professional
$60
per user/per month
Organization
Contact sales team
No answers on this topic
Offerings
Pricing Offerings
Chartio (discontinued)
Looker
Free Trial
Yes
Yes
Free/Freemium Version
No
No
Premium Consulting/Integration Services
Yes
Yes
Entry-level Setup Fee
No setup fee
Required
Additional Details
—
Must contact sales team for pricing.
More Pricing Information
Community Pulse
Chartio (discontinued)
Looker
Considered Both Products
Atlassian
Verified User
Chose Chartio (discontinued)
Chartio so far has been the easiest BI tool to setup and has also been the most affordable. There are some other, great, BI tools out there but they were a bit to heavy handed for what we needed. Also - despite the high cost per user in Chartio, the other tools were still more …
A de minimis incentive was given to thank the reviewer for their time. The incentive was not used to bias or drive a particular response, nor was the incentive contingent on a positive endorsement. More Info
Product Manager in Product Management at Teem (Computer Software, 51-200 employees)
Chose Chartio (discontinued)
Initially, we selected chartio because it was the easiest to connect to data and get going making visualizations. Ultimately, we moved away from Chartio because we needed a tool that would work as a buffer between our data structure and the visualizations. But majority of BI …
A de minimis incentive was given to thank the reviewer for their time. The incentive was not used to bias or drive a particular response, nor was the incentive contingent on a positive endorsement. More Info
Product Manager, Analytics in Information Technology at Autodesk (Computer Software, 5001-10,000 employees)
Chose Looker
Mode & Chartio require user to write SQL. Looker – Looker has very powerful data modeling layer – LookML that allows data engineers to abstract end users away from the complexity of underlying data (and SQL). End users can perform analysis by selecting dimensions, measures, …
A de minimis incentive was given to thank the reviewer for their time. The incentive was not used to bias or drive a particular response, nor was the incentive contingent on a positive endorsement. More Info
Product Manager, Data & Analytics in Product Management at Crowdtap (Marketing and Advertising, 51-200 employees)
Chose Looker
Tableau- Not web based which makes it more difficult to use and share templates etc. Seems more dated. ChartIO - Looker's LookML layer that predefined joins was appealing to us vs a tool like ChartIO which requires more raw SQL comprehension.
A de minimis incentive was given to thank the reviewer for their time. The incentive was not used to bias or drive a particular response, nor was the incentive contingent on a positive endorsement. TR verified that a representative sample of customers was invited. More Info
Chartio is a great tool for building presentable dashboards. It can export, you can add read-only access, and it has permissions levels by dashboard for users. There are other data analysis tools that help to analyze the data, but few allow for such a nice presentation
Great customer support: You will receive an answer by email usually within 20-30 minutes. Not only that but our CSMs for Chartio go out of their way to help, they have even created charts for some of the less experienced users that wanted an example to work from. We have had nothing but great experiences with this team.
A de minimis incentive was given to thank the reviewer for their time. The incentive was not used to bias or drive a particular response, nor was the incentive contingent on a positive endorsement. More Info
Looker is relatively easy to use, even as it is set up. The customers for the front-end only have issues with the initial setup for looker ml creations. Other "looks" are relatively easy to set up, depending on the ETL and the data which is coming into Looker on a regular basis.
A de minimis incentive was given to thank the reviewer for their time. The incentive was not used to bias or drive a particular response, nor was the incentive contingent on a positive endorsement. More Info
A de minimis incentive was given to thank the reviewer for their time. The incentive was not used to bias or drive a particular response, nor was the incentive contingent on a positive endorsement. TR verified that a representative sample of customers was invited. More Info
Somehow resources heavy, both on server and client. I recommned at least 50Mbs data rate and high performance desktop comouter to be abke to run comolex tasks and configure larger amount of data. On the other hand, the client does not need to worry when viewing, the performance is usually ok
A de minimis incentive was given to thank the reviewer for their time. The incentive was not used to bias or drive a particular response, nor was the incentive contingent on a positive endorsement. TR verified that a representative sample of customers was invited. More Info
Never had to work with support for issues. Any questions we had, they would respond promptly and clearly. The one-time setup was easy, by reading documentation. If the feature is not supported, they will add a feature request. In this case, LDAP support was requested over OKTA. They are looking into it.
A de minimis incentive was given to thank the reviewer for their time. The incentive was not used to bias or drive a particular response, nor was the incentive contingent on a positive endorsement. More Info
A de minimis incentive was given to thank the reviewer for their time. The incentive was not used to bias or drive a particular response, nor was the incentive contingent on a positive endorsement. TR verified that a representative sample of customers was invited. More Info
A de minimis incentive was given to thank the reviewer for their time. The incentive was not used to bias or drive a particular response, nor was the incentive contingent on a positive endorsement. TR verified that a representative sample of customers was invited. More Info
Chartio has worked well as our datawarehouse has rapidly expanded, and the usability/performance hasn't seemed to have suffered. What we haven't yet realized is additional savings from additional users. We have some dashboard needs for users who truly just view of a few charts, and the licensing structure hasn't yet been structured in a way that would support that type of approach...having 50 "core" licenses, and then potentially several hundred view only licenses for partners that would use the application infrequently.