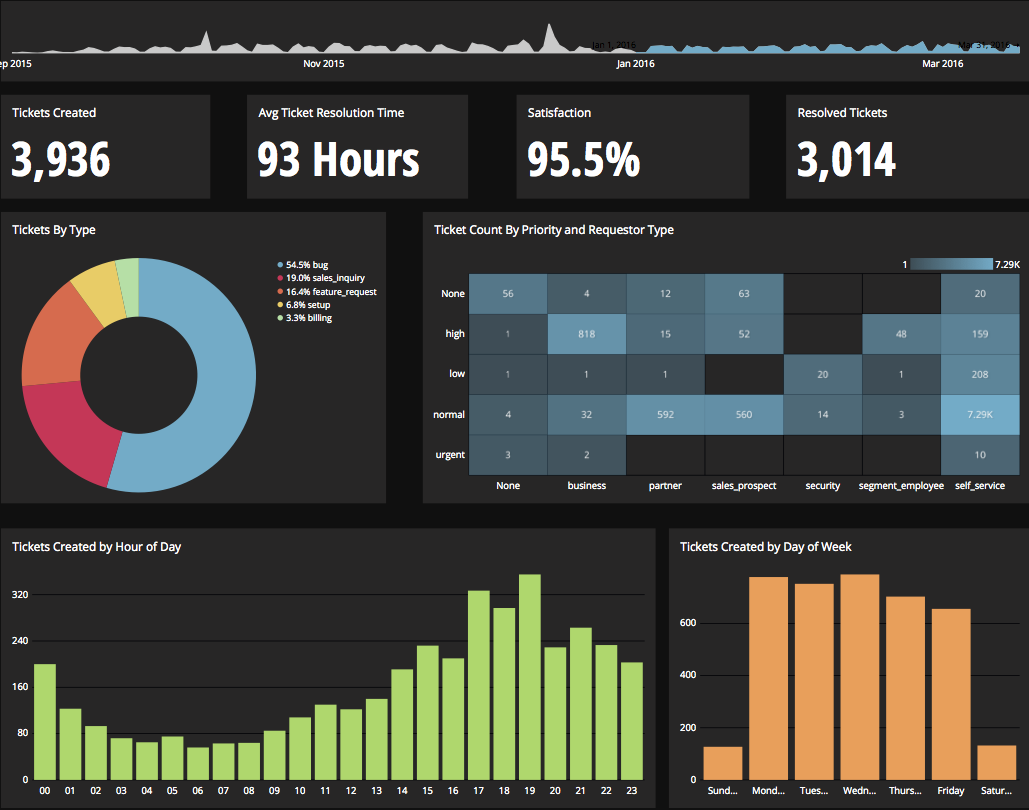
Chartio is a visualization tool designed to enable anyone to explore, transform and visualize data on the fly through a drag-and-drop interface. Chartio was acquired by Atlassian in February 2021 so that it's capabilities could be integrated into the Atlassian product portfolio's capabilities. Chartio is no longer available to new customers, standalone. Existing customers must migrate to alternatives by March 2022, when the service will be retired.
$40
per user/per month
JMP
Score 9.2 out of 10
N/A
JMP® is statistical analysis software with capabilities that span from data access to advanced statistical techniques, with click of a button sharing. The software is interactive and visual, and statistically deep enough to allow users to see and explore data.
$1,320
per year per user
Pricing
Chartio (discontinued)
JMP
Editions & Modules
Starter
$40
per user/per month
Professional
$60
per user/per month
Organization
Contact sales team
JMP
$1320
per year per user
Offerings
Pricing Offerings
Chartio (discontinued)
JMP
Free Trial
Yes
Yes
Free/Freemium Version
No
No
Premium Consulting/Integration Services
No
No
Entry-level Setup Fee
No setup fee
No setup fee
Additional Details
—
Bulk discounts available.
More Pricing Information
Community Pulse
Chartio (discontinued)
JMP
Features
Chartio (discontinued)
JMP
BI Standard Reporting
Comparison of BI Standard Reporting features of Product A and Product B
Chartio (discontinued)
6.0
Ratings
33% below category average
JMP
-
Ratings
Pixel Perfect reports
3.60 Ratings
00 Ratings
Customizable dashboards
7.70 Ratings
00 Ratings
Report Formatting Templates
6.70 Ratings
00 Ratings
Ad-hoc Reporting
Comparison of Ad-hoc Reporting features of Product A and Product B
Chartio (discontinued)
5.7
Ratings
33% below category average
JMP
-
Ratings
Drill-down analysis
6.90 Ratings
00 Ratings
Formatting capabilities
6.10 Ratings
00 Ratings
Integration with R or other statistical packages
3.10 Ratings
00 Ratings
Report sharing and collaboration
6.50 Ratings
00 Ratings
Report Output and Scheduling
Comparison of Report Output and Scheduling features of Product A and Product B
Chartio (discontinued)
3.4
Ratings
85% below category average
JMP
-
Ratings
Publish to Web
2.70 Ratings
00 Ratings
Publish to PDF
6.10 Ratings
00 Ratings
Report Versioning
2.00 Ratings
00 Ratings
Report Delivery Scheduling
2.70 Ratings
00 Ratings
Data Discovery and Visualization
Comparison of Data Discovery and Visualization features of Product A and Product B
This product is well suited for end users that don't want to get too in depth with reporting. The interface is simple and the default filter options are sufficient for a general report. Example: Total Sum of Net Sales for all products sold in X State between dates X and X. If the need is for a more complex query, then there is the Custom Query option. This would be something that an administrator would have to police as having users writing their own queries could get really messy really fast. I suppose the key questions to ask would be: Do you need a product that will... display all relevant charts/reports in one consistent place? ... be simple for an end user to navigate? ...be web-based and remotely accessed?
Many organizations have seen their analytical capabilities, and the results from them, plateau. Of these, we've observed, that most of them didn't appreciate that they could do (even) better. These companies should definitely consider JMP. Any company that is research-based can benefit from accelerating their research, learning more in less time, effort and cost, with JMP's tools. Basically, any organization that is hungry enough for improvement to seek out better ways is suitable for JMP. Those who are happy with their current performance are not likely to consider the changes, though they were not major impediments by our clients, required.
Constantly updating: many of the BI tools we looked at were slow to iterate on their product. This was a main selling point for us.
Ease of Use: We have many users that are new to BIs tools and database management in general. BI software as a whole has a pretty steep learning curve for most people, but Chartio does a good job of making things easier all around.
Database Support: It seems as though every department insists on storing their information using different databases. Chartio had support for everyone one we needed which was very helpful.
It has become a core part of the business in terms of identifying the health of our network. If we grow and there are certain things that might not fit well with Chartio (e.g. we'd want to store snapshots of every single day's dash instead of seeing realtime data), it might make sense to move some of the data analysis tool in-house if resources are available.
I've mentioned this earlier, but the licensing agreements are very prohibitive. I work with a company where my role has become less and less doing my own analytics and more and more trying to help other people in that role. As we are bringing more people "up to speed" it's hard to justify licenses for 2-3 people when they aren't full time, Six Sigma black belts just looking at stats all day. A floating license option would make this a no-brainer, since these people could continue their other work and add JMP usage as they grow their skills, but this is not something JMP/SAS has offered.
I really like using Chartio. I use it on a daily basis for pulling data from different sources and combining data (the explore tab was a great idea for this use). I think I would give it 8/10 because there needs to be more documentation or maybe blog posts about things people are doing with it. I only have my own ideas about what to do /how to graph things. I know there are some articles, but it would be awesome to have a section on the neat dashboards people are building or how they show data in different ways. Another complaint is how much time it takes to load. I know our databases aren't set up precisely for Chartio and I have been creating data stores. But the data stores have so many more limitations that adds a whole new layer of frustration. Love the product, keep up the good work and the fast fixes.
The GUI interface makes it easier to generate plots and find statistics without having to write code. The JSL scripting is a bit of a steep learning curve but does give you more ability to customize your analysis. Overall, I would recommend JMP as a good product for overall usability.
The helpful tips are great for new users. I am always able to find solutions to a tool I am working with through the hep section. And my area has a users group that meets each quarter to share ideas and view upcoming JMP revisions.
I use self learning materials. Pretty helpful. I find myself having to go back to the "drilldown" instructions though, and have a hard time finding hidden variables on a dashboard, so perhaps there is room for intuitive improvements (or maybe I'm just being lazy)
Again, Chartio provides the best multi-user presentation ability for us. Other tools are great for slicing and dicing the data, but at the end, you still have to spend time trying to find a way to present it. Chartio has that built in.
We actually use both JMP and IBM SPSS, but I think JMP's complexity lends itself to more in-depth statistical analyses. SPSS is designed for that as well, but we tend to use it more for quicker analyses, and we have found that JMP is far more powerful.
Chartio has worked well as our datawarehouse has rapidly expanded, and the usability/performance hasn't seemed to have suffered. What we haven't yet realized is additional savings from additional users. We have some dashboard needs for users who truly just view of a few charts, and the licensing structure hasn't yet been structured in a way that would support that type of approach...having 50 "core" licenses, and then potentially several hundred view only licenses for partners that would use the application infrequently.
JMP has resulted in literally millions of dollars in ROI due to identification of correctable errors.
Use of JMP control charts JMP has greatly simplified and improved interpretation of Lean, FMEA, and PDSA type analyses.
Use of JMP has enable the testing and subsequent selection of 'best practices' saving uncounted hours in false starts based on 'collective experience'.
The down side is that JMP is not a 'magic box', one still has to take care in applying the tools properly. Moreover, time-consuming approaches using JMP may still be the 'order of the day', because the service (even power user) is unaware of significant shortcuts available for free on the JMP community website.