AppNeta provides performance monitoring solutions for distributed, cloud-connected, digital enterprises. AppNeta’s SaaS-based solutions give IT teams application and network performance data, allowing them to constantly monitor user experience across any application, network, data center or cloud.
N/A
New Relic
Score 7.8 out of 10
N/A
New Relic is a SaaS-based web and mobile application performance management provider for the cloud and the datacenter. They provide code-level diagnostics for dedicated infrastructures, the cloud, or hybrid environments and real time monitoring.
$0
No credit card required; 100 GB free ingest per month, 1 free full user + unlimited basic users, 8 days retention, 100 Synthetics Checks
Pricing
AppNeta
New Relic
Editions & Modules
No answers on this topic
Free (Forever)
$0
No credit card required; 100 GB free ingest per month, 1 free full user + unlimited basic users, 8 days retention, 100 Synthetics Checks
Telemetry Data Platform
$0.25
per month per extra GB data ingest (after first free 100GB per month)
Incident Intelligence
$0.50
per month per event (after first 1000 free events per month)
Standard
$99
per month per full user (after first free full user - unlimited free basic users)
I tried AppNetta, Capterra, and a few similar commercial tools when evaluating APM solutions, but NewRelic is so well integrated with so many services and pieces of software that it would have taken a lot more time to implement and support another solution. New Relic worked out …
Tracelytics was a great product, but data retention was lacking as was enterprise level features. The ability to pay per trace instead of per server was a great help in financing, but in the end the data wasn't available long enough to perform historical analysis and therefore …
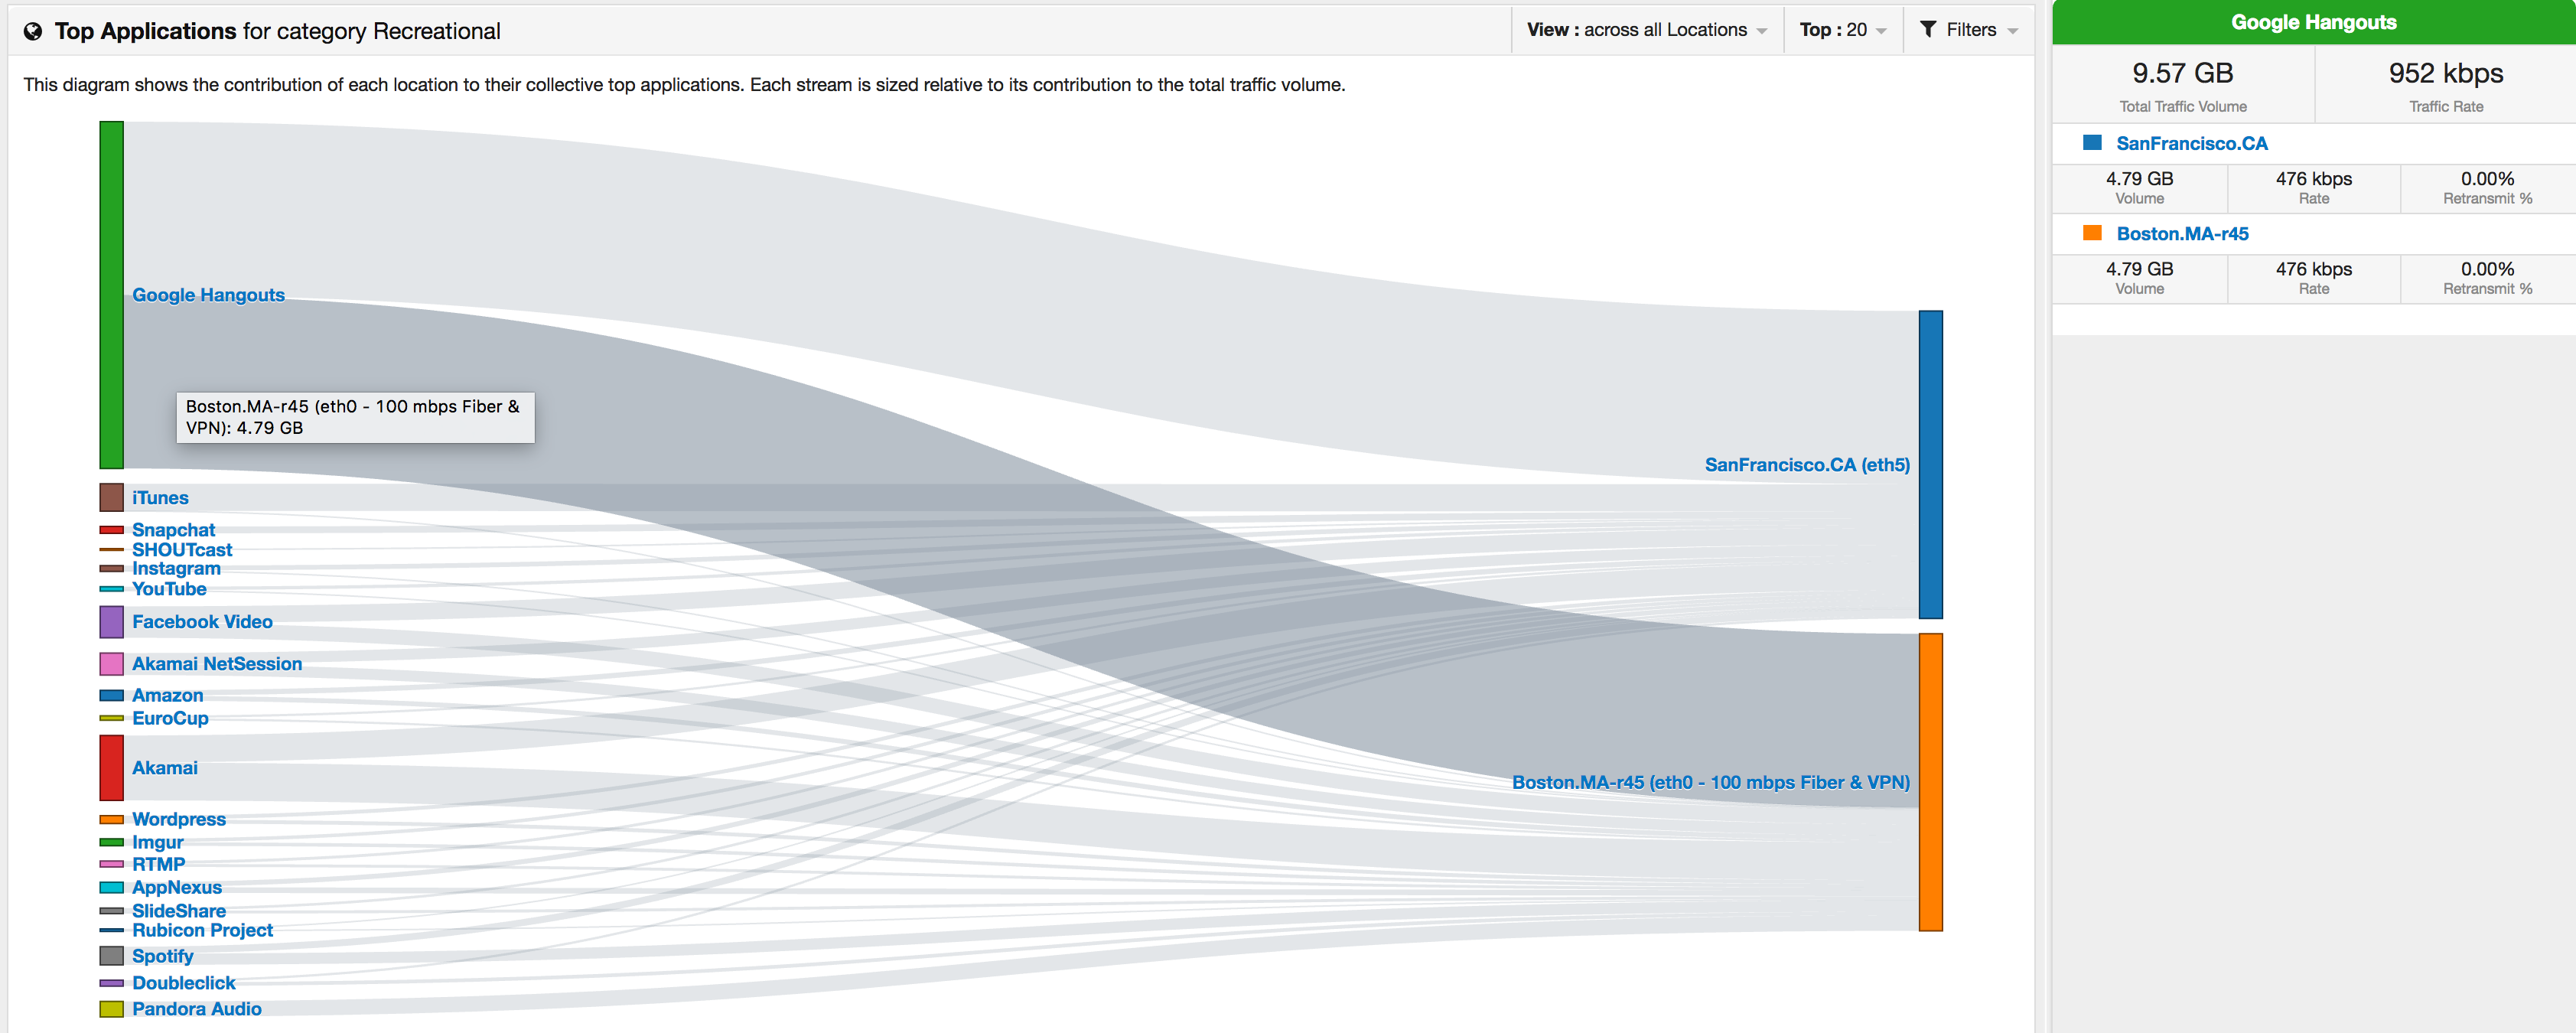
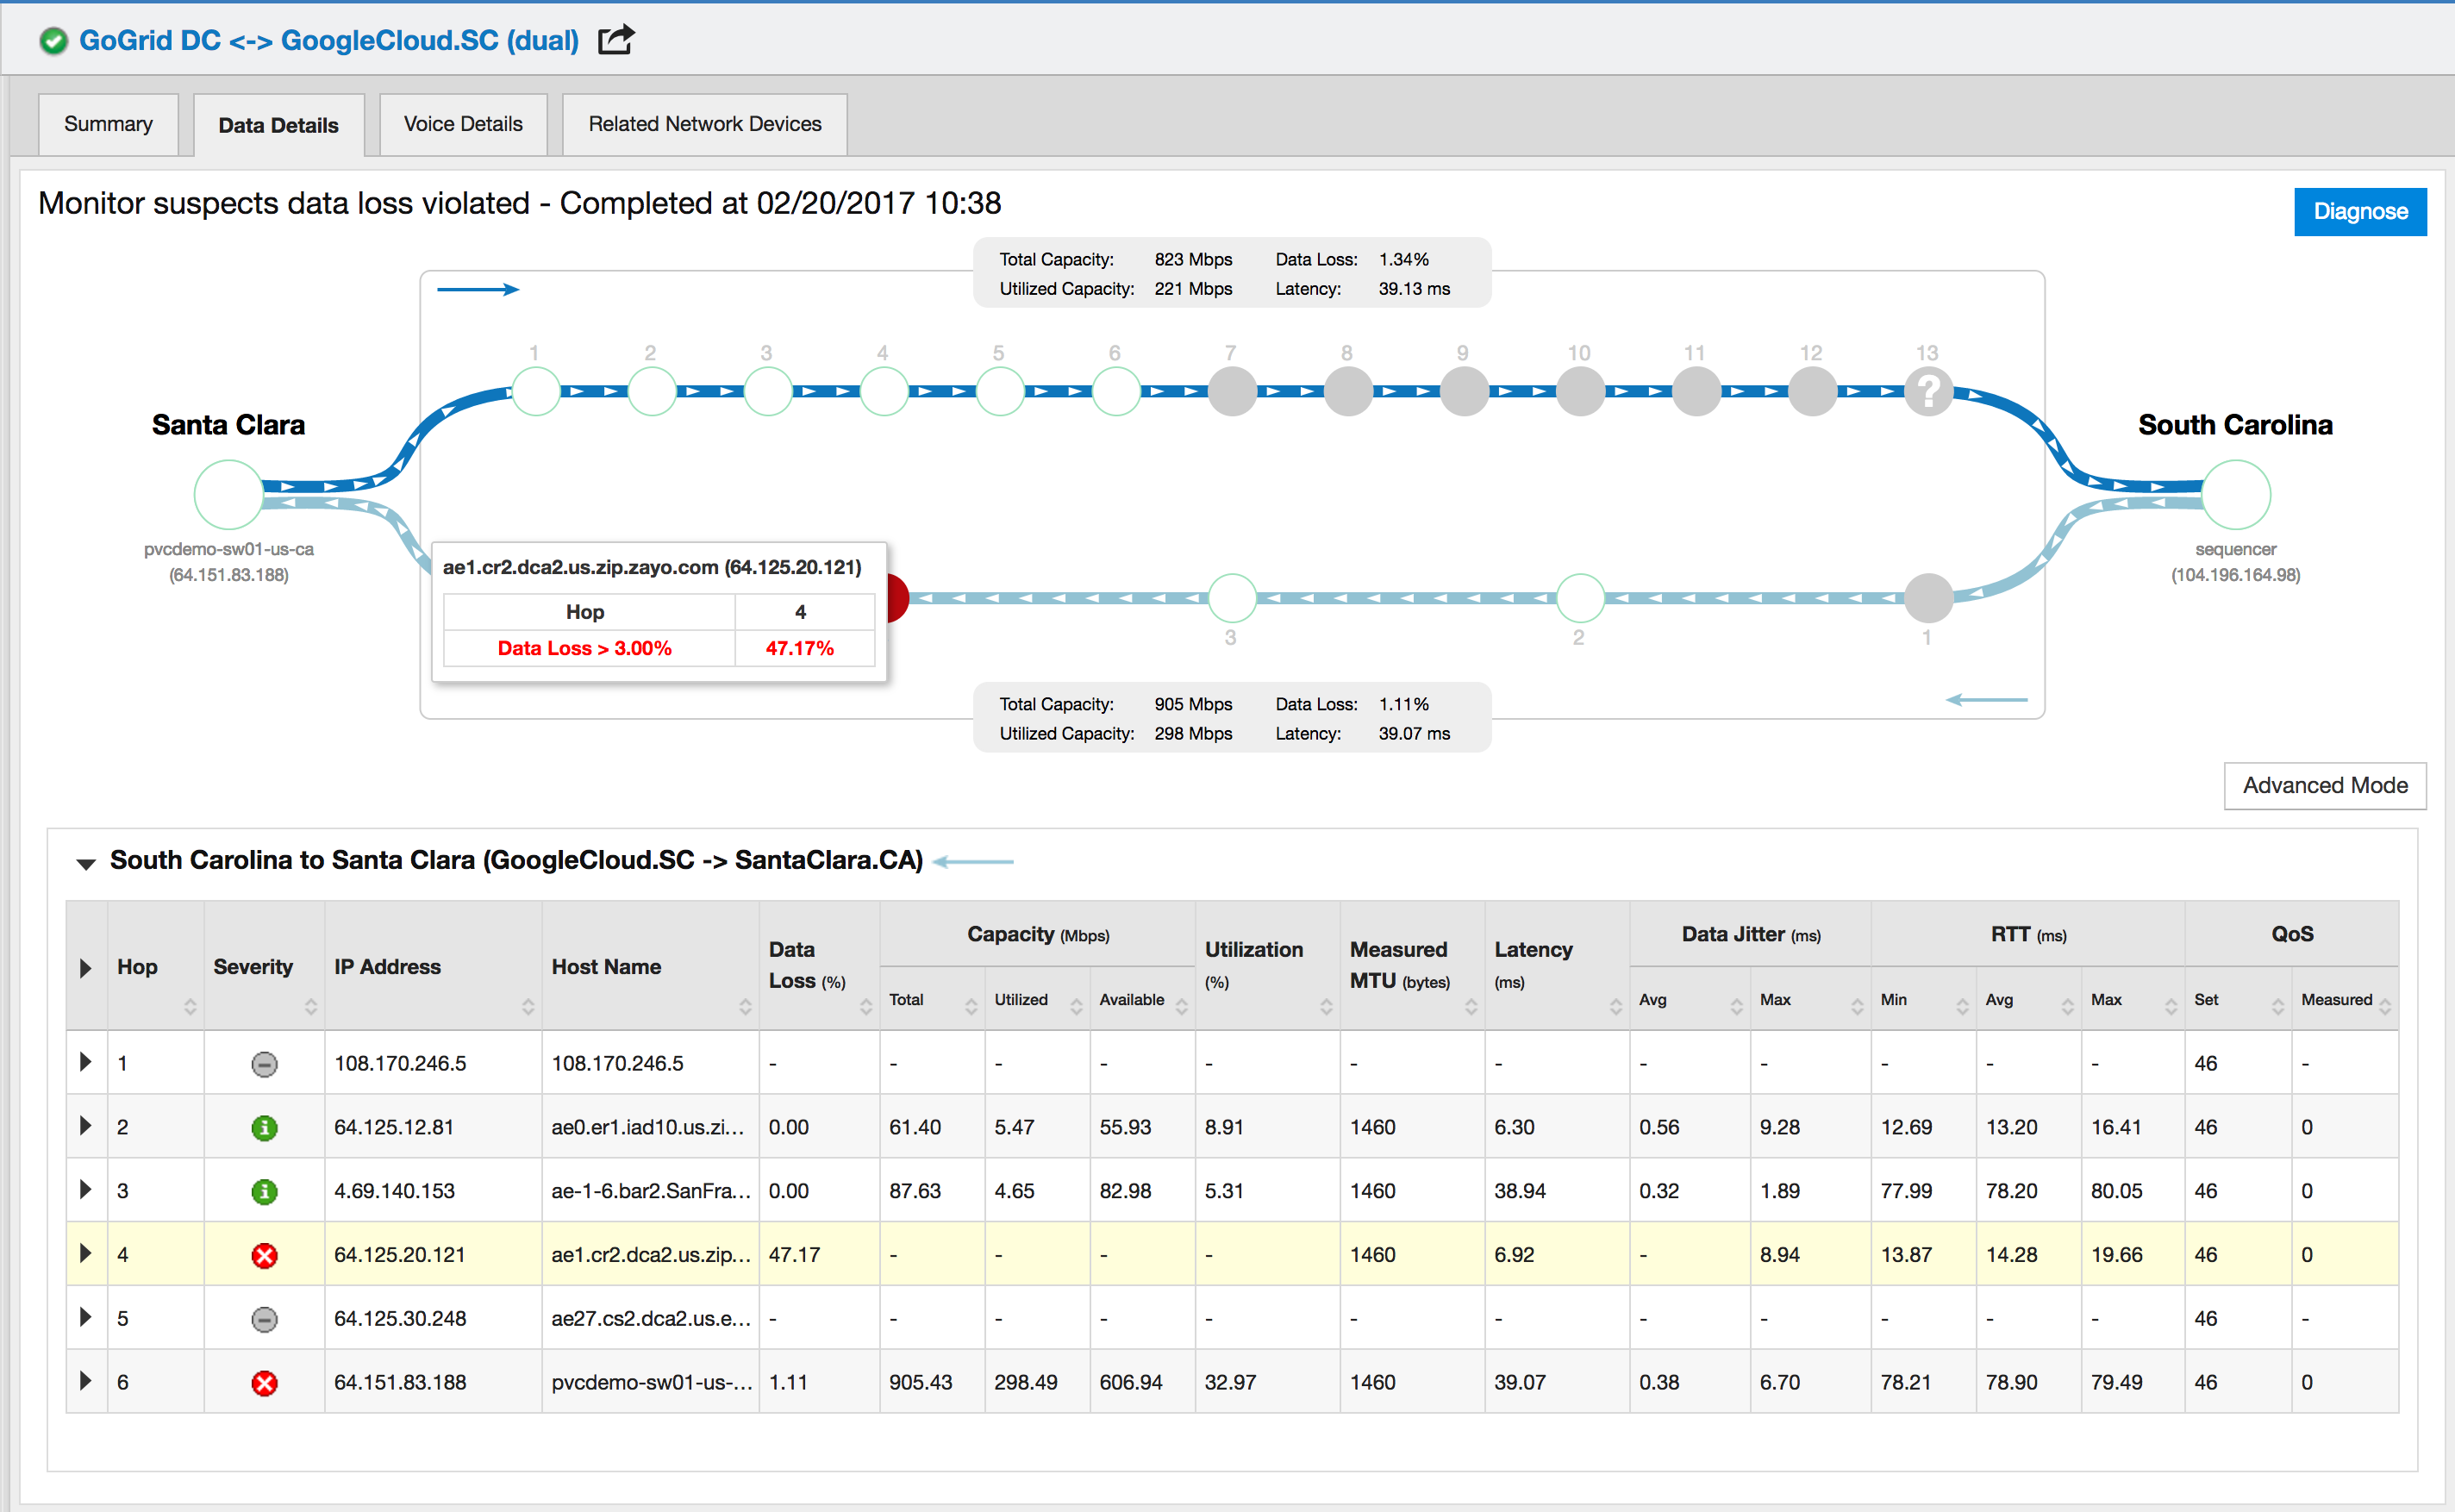
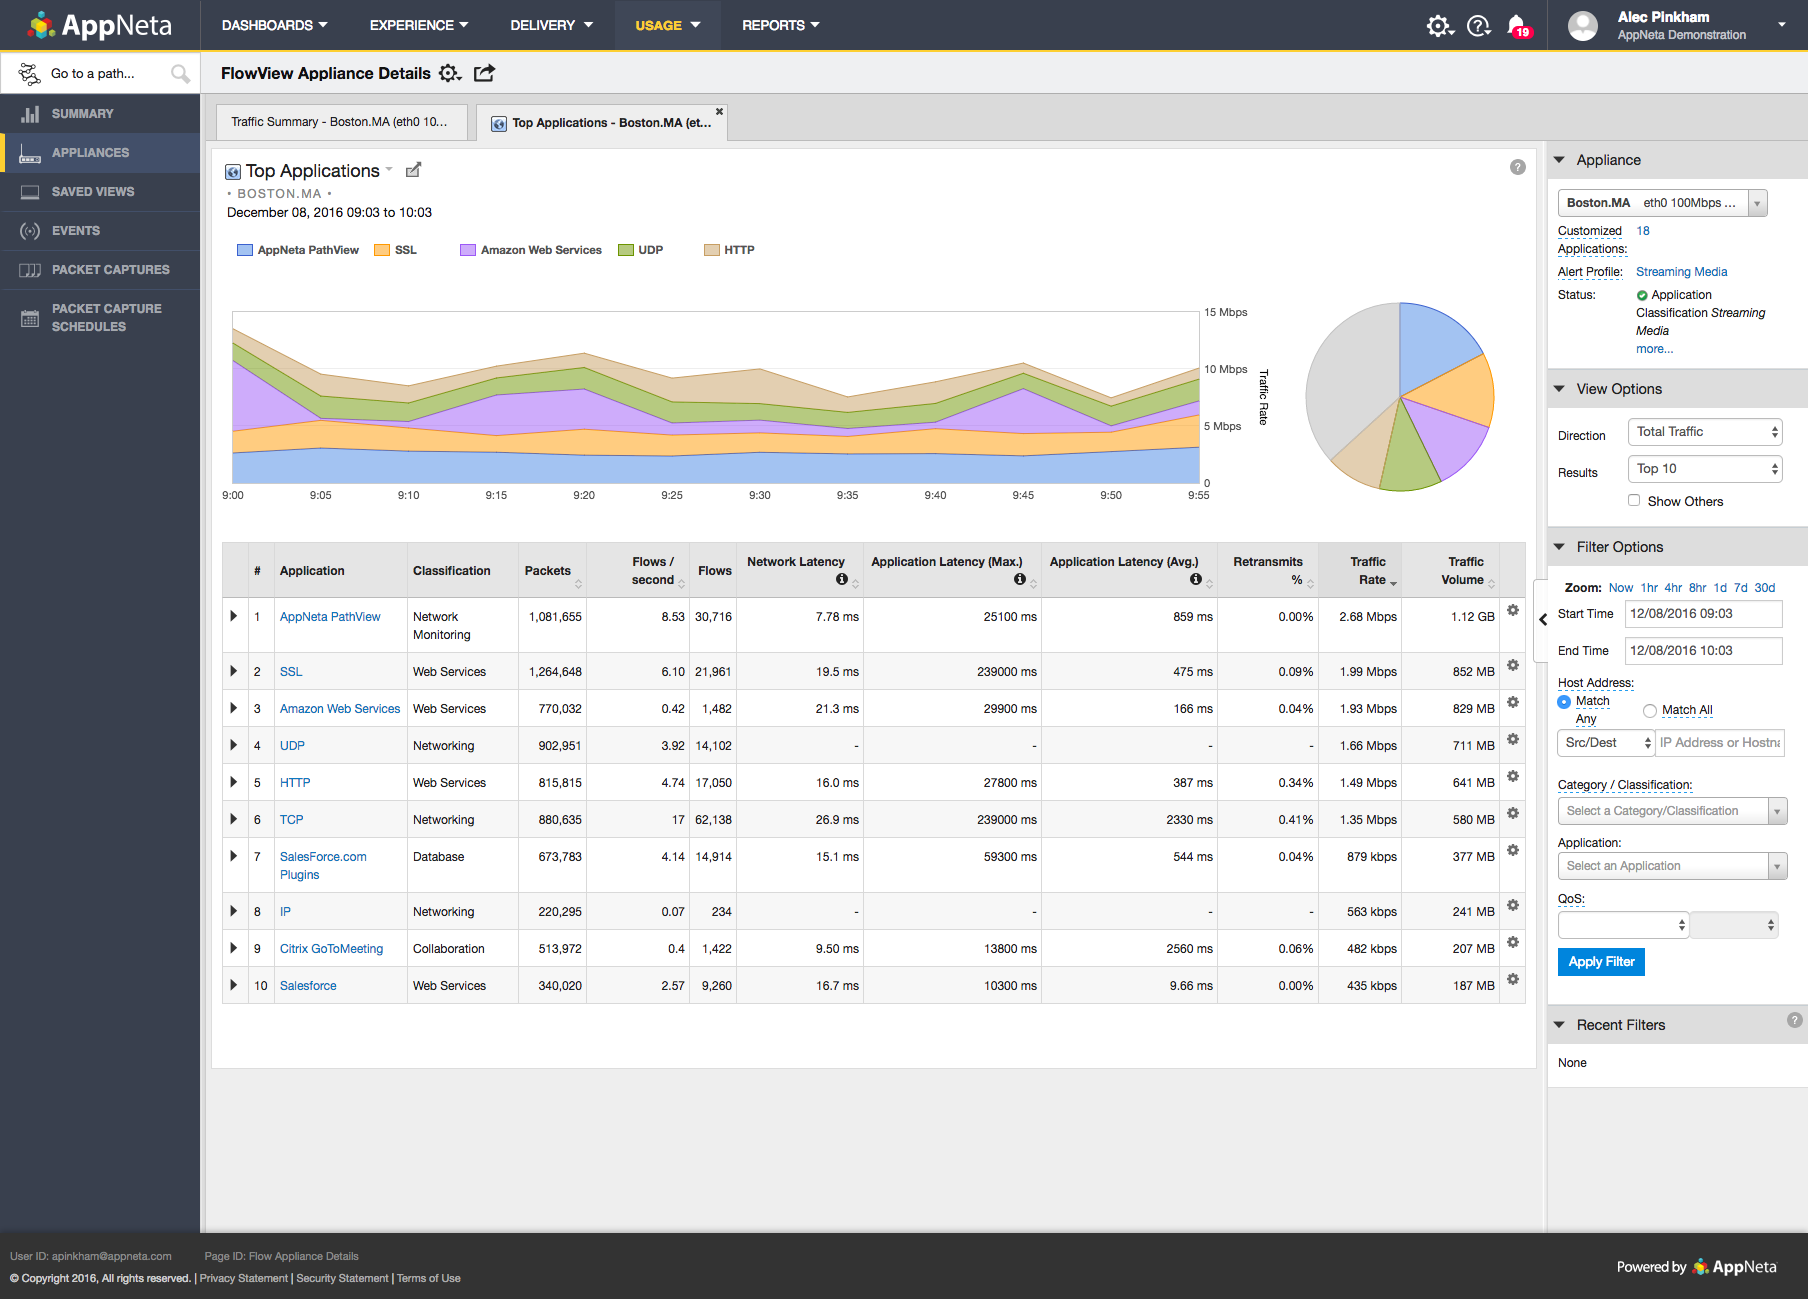
AppNeta is awesome for getting site-to-site statistics or trying to find out why at 3 am every night, this server loses connectivity to another server in a different data center. But we have found the multiple bugs in the hardware hard to deal with when the devices are a 4-hour plane ride away and require someone to console into the device.
I have used New Relic in different scenarios like monitoring my production infrastructure and applications which helps us to reduce the downtime of my applications and websites and also I have used the synthetic monitoring feature which helps to proactively monitor our websites availability. Along with this I have also used New Relic for cloud resources cost monitoring which helps to reduce my cloud cost. Also I have used mobile application monitoring which helps me to trace the sessions easily and I can easily reduce my RCA through the help of that.
New Relic APM allows us to follow up transactions across services and trace performance bottlenecks in real-time, crucial when monitoring the processing of energy loads or predictive maintenance algorithms.
It gives us deep visibility into our cloud servers, containers and IOT gateways, so we can catch CPU spikes or memory leaks which can impact the data we ingest from the field devices.
We develop custom dashboards for monitoring trends of power consumption, abnormality in sensors and API health. In conjunction with alerting, it makes sure we are fixing issues before customers even see them.
The only issue that we have had with New Relic is that the price might be a little expensive for smaller companies. The amount of data you store in New Relic impacts the cost, and can get away from you if you don't work closely with the vendor. Overall though the application is top notch.
New Relic helps in observability setup for the critical environments and getting known about the issues and troubleshoot the applications and services. Alerts helps in knowing the abnormal state of the system and services, Dashboards are used for visualizing the key metrics and muting the unwanted notifications and dropping the extra data from the source.
The support team has been really helpful and resolved most of the issues on time. However, for a couple of issues, several follow-ups were needed to elicit a reasonable response. The issue was deeply technical and could have been investigated only by their Architects, and bringing them into the ticket took longer than needed
It's better to start by implementing New Relic in one project and test everything. Try to follow best recommended practices and read all the official documentation. Everything seems well tested. Then, start by installing agents to the rest of your projects and keep a close look to all logs and metrics New Relic gives you.
New Relic has full stack visibility and gives us all options for observability like one stop shop. It gives you front end, backend as well synthetic monitoring capabilities. Every other feature built into one cost model (usually) which ties to data that you send, it helps you leverage all features without having to pay additional charge for feature