Frontline Systems Analytic Solver is an Excel add-on for performing data mining, and predictive analytics from within Microsoft Excel.
N/A
OpenText Magellan
Score 9.0 out of 10
N/A
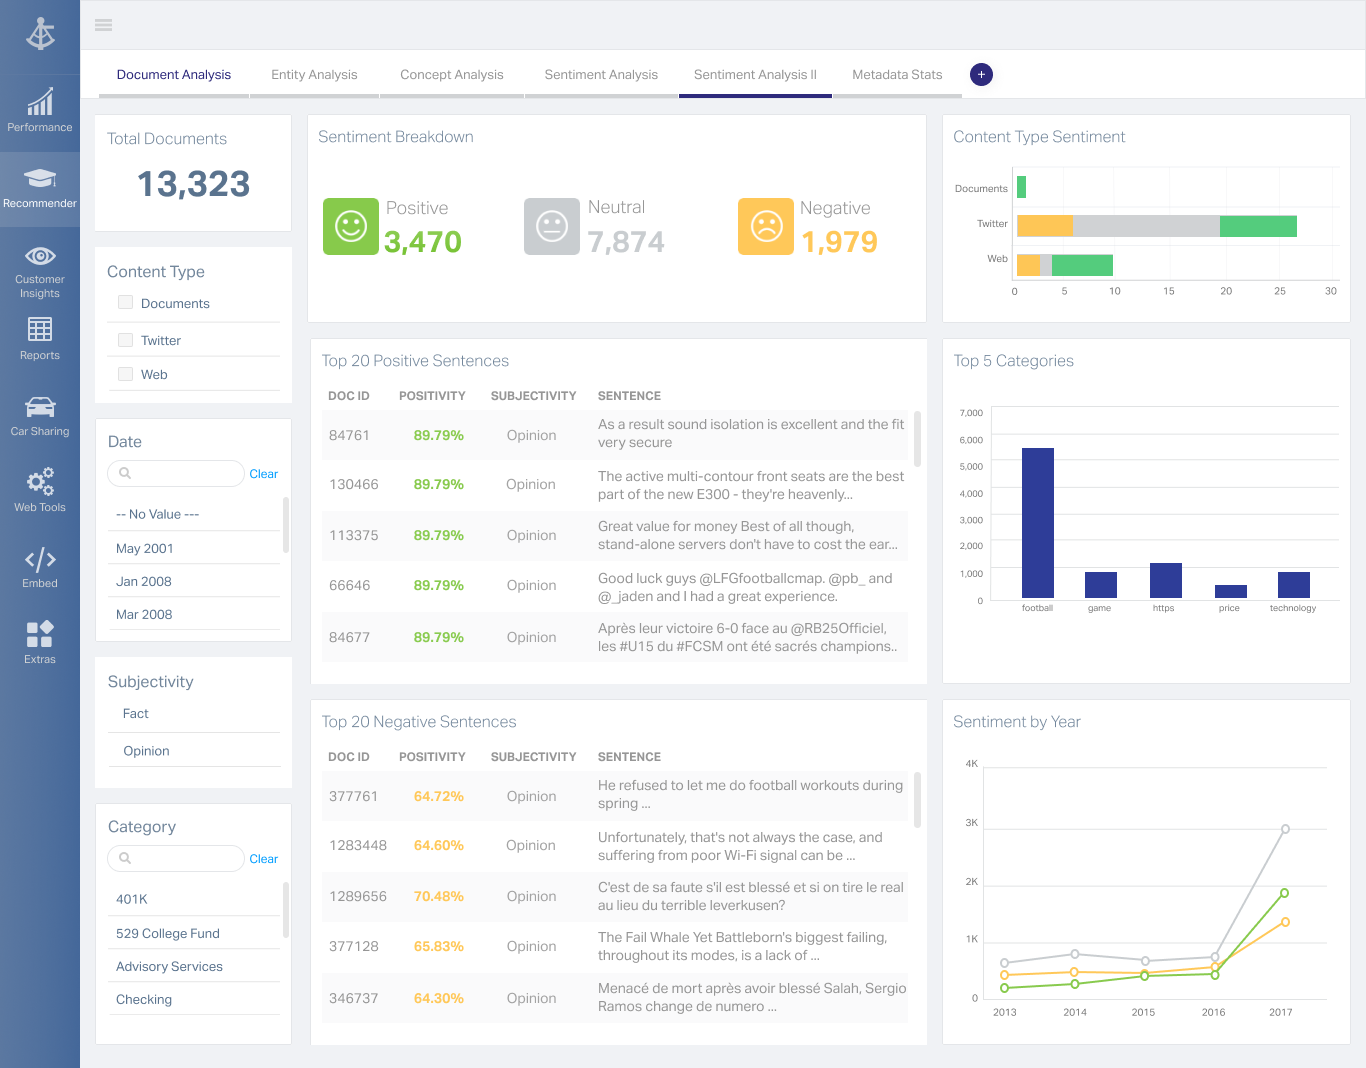
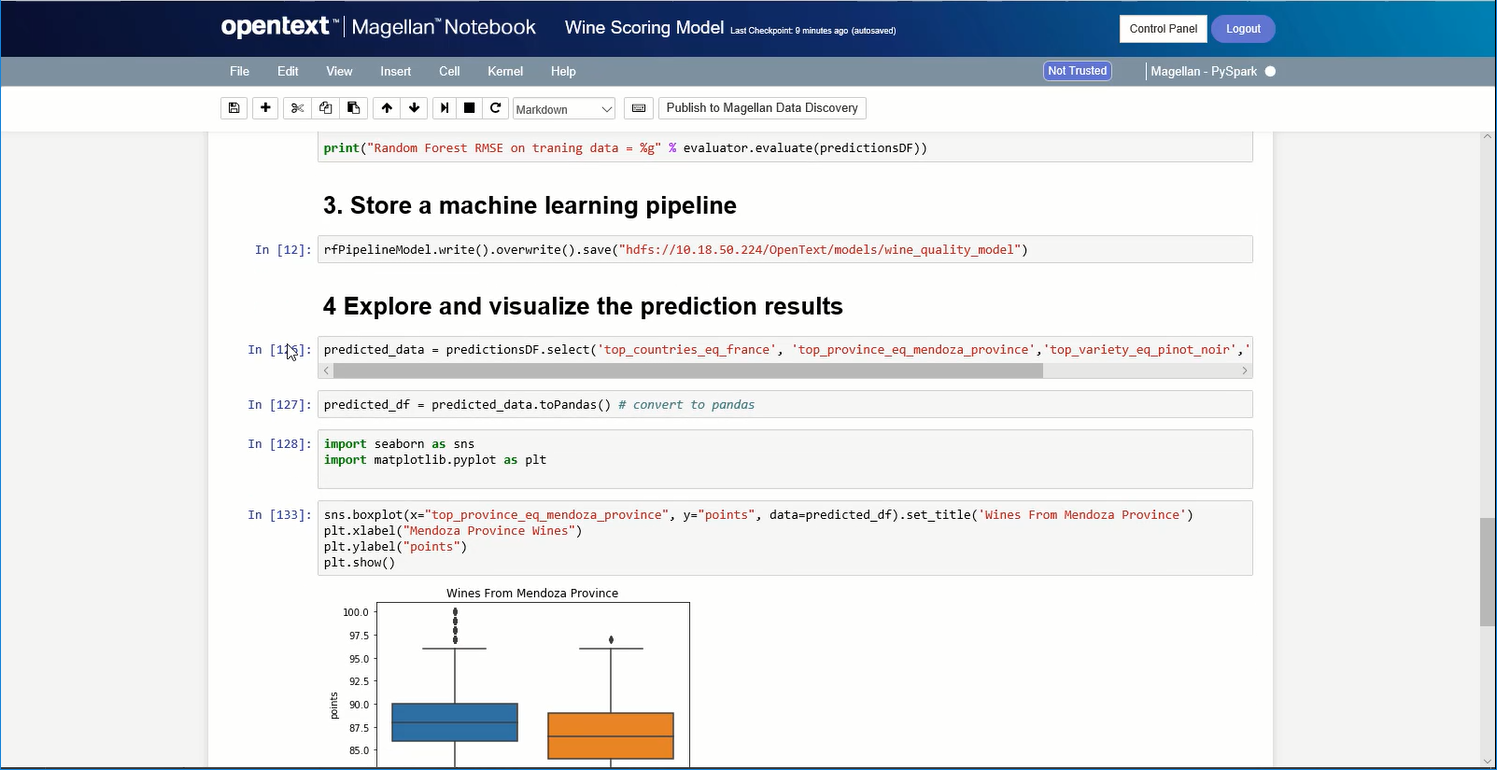
OpenText Magellan Analytics Suite leverages a comprehensive set of data analytics software to identify patterns, relationships and trends through data visualizations and interactive dashboards.
N/A
Pricing
Analytic Solver
OpenText Magellan
Editions & Modules
No answers on this topic
No answers on this topic
Offerings
Pricing Offerings
Analytic Solver
OpenText Magellan
Free Trial
No
No
Free/Freemium Version
No
No
Premium Consulting/Integration Services
No
No
Entry-level Setup Fee
No setup fee
No setup fee
Additional Details
—
—
More Pricing Information
Community Pulse
Analytic Solver
OpenText Magellan
Features
Analytic Solver
OpenText Magellan
BI Standard Reporting
Comparison of BI Standard Reporting features of Product A and Product B
Analytic Solver
-
Ratings
OpenText Magellan
7.0
Ratings
15% below category average
Customizable dashboards
00 Ratings
7.00 Ratings
Report Formatting Templates
00 Ratings
7.00 Ratings
Ad-hoc Reporting
Comparison of Ad-hoc Reporting features of Product A and Product B
Analytic Solver
-
Ratings
OpenText Magellan
8.3
Ratings
3% above category average
Drill-down analysis
00 Ratings
8.00 Ratings
Formatting capabilities
00 Ratings
8.00 Ratings
Integration with R or other statistical packages
00 Ratings
9.00 Ratings
Report sharing and collaboration
00 Ratings
8.00 Ratings
Report Output and Scheduling
Comparison of Report Output and Scheduling features of Product A and Product B
Analytic Solver
-
Ratings
OpenText Magellan
8.3
Ratings
0% below category average
Publish to Web
00 Ratings
8.00 Ratings
Publish to PDF
00 Ratings
8.00 Ratings
Report Versioning
00 Ratings
9.00 Ratings
Report Delivery Scheduling
00 Ratings
8.00 Ratings
Data Discovery and Visualization
Comparison of Data Discovery and Visualization features of Product A and Product B
1. It is good tool for a mathematical model which is a single period and deterministic model 2. It is good for the users who are comfortable in handling the Excel Solver and needs to upgrade the Excel Solver for more than 200 variables 3. It works well for the multiple objective problems. 4. Difficult to manage the big model as 100 constraints and 2000 variables can limit the use of the tool's efficiency. 5. Its limitation is that a model designer can not make a big and complex model.
It depends on extensibility, set-up, access & style. Actuate performs fairly well, but has performance issues because it sits on top of eclipse, which sits on top of Java. Extensibility usually comes at that price. Set-up is fairly straightforward and it can be secured.
On the few occasions when I have used it to deal with problems of optimization of relatively large parameters (with a large number of restrictions and decision variables), the program has been slower, not substantially but slower, than programs such as the WinQsb, even when the latter runs on 32-bit machines and not 64. That has caught my attention, even though it is not a real problem for the uses I give to the program.
Given my partial function as a university professor, it has been much more effective and practical to use other software, due to the limited options that the educational license associated with the software has.
I am no longer working for the company that was using Actuate but I believe they would continue to use it because the stitching costs would be to high. It would require a complete rewrite of the reports and the never version of Actuate (BIRT) even required an almost complete report rewrite
It is quite intuitive to use. It is fit specifically for doing sentiment, emotion, and intention analysis as well as text classification and text summarization. I would have given 10 if it is fit for the purpose of doing image processing and analysis as well. There is a huge market to analyze video and image data.
The use of this software does not necessarily follow that it is "globally better" than others. In the department we have used this and others with similar characteristics, given that, as previously indicated, all the software has advantages and weaknesses with respect to other software with similar characteristics. Obtaining better results lies in the user's ability to detect those "benefits and weaknesses" and maximize their usefulness within the specific field of work in which they operate. In our case, one of the reasons that led us to try and use it, was related to trying to "tie" more processes to the same environment, which in this case is the one associated with the Excel database, in such a way as to reduce the initial manipulation and accommodation that should be made to the data if they come from different sources such as MATLAB, or WinQsb. This facilitates the use of software for the type of user who does not necessarily have deep knowledge of linear algebra or operations research, for example.
On the contrary, the most analytical and knowledgeable user manifested in a high percentage, preferring to use MATLAB as a tool, claiming that they have a greater and easier access to the calculation functions, which even in specific cases, could be modified.
It is vastly superior to these in many ways, for complex reporting it is a much more sophisticated solution. Visualizations are very good. Javascript extensibility is very powerful, others don't support this or as well. Pentaho and MS are both OLAP oriented. Pentaho is moving more toward big data, which was not our primary focus. Others are stuck in the Crystal Reports Band metaphor.
- It has allowed finding ways to optimize (minimizing costs or times) the field processes involved in various projects.
It has even allowed, in specific cases where it was used for that purpose, to optimize the allocation of resources (people) to work in different jobs that present weekly variations of the activity that these people must perform.
It has allowed the sensitivity analysis of projects to changes in the decision variables related to them, which, and in very dynamic and changing environments, resulted in substantial decreases in money losses.
Actuate can handle 50 to 60 sub reports inside a report very well.
Dynamically creating the datasource, chart, graph, reports are the main advantages. We can do any level of drilling, and can create a performance matrix dashboard efficiently.