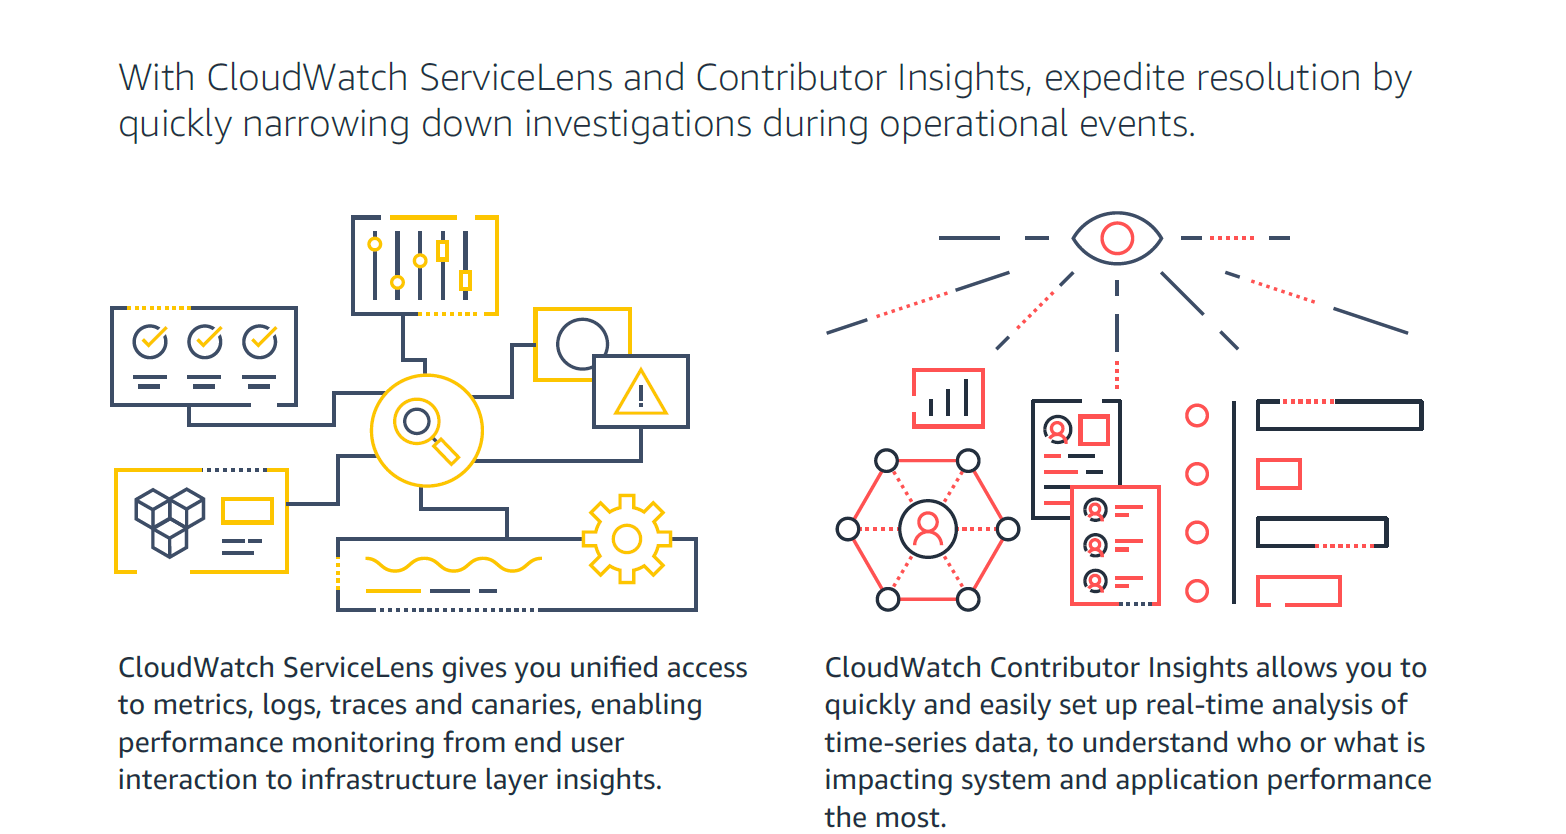
Amazon CloudWatch is a native AWS monitoring tool for AWS programs. It provides data collection and resource monitoring capabilities.
$0
per canary run
IBM Turbonomic
Score9.3 out of 10
Enterprise companies (1,001+ employees)
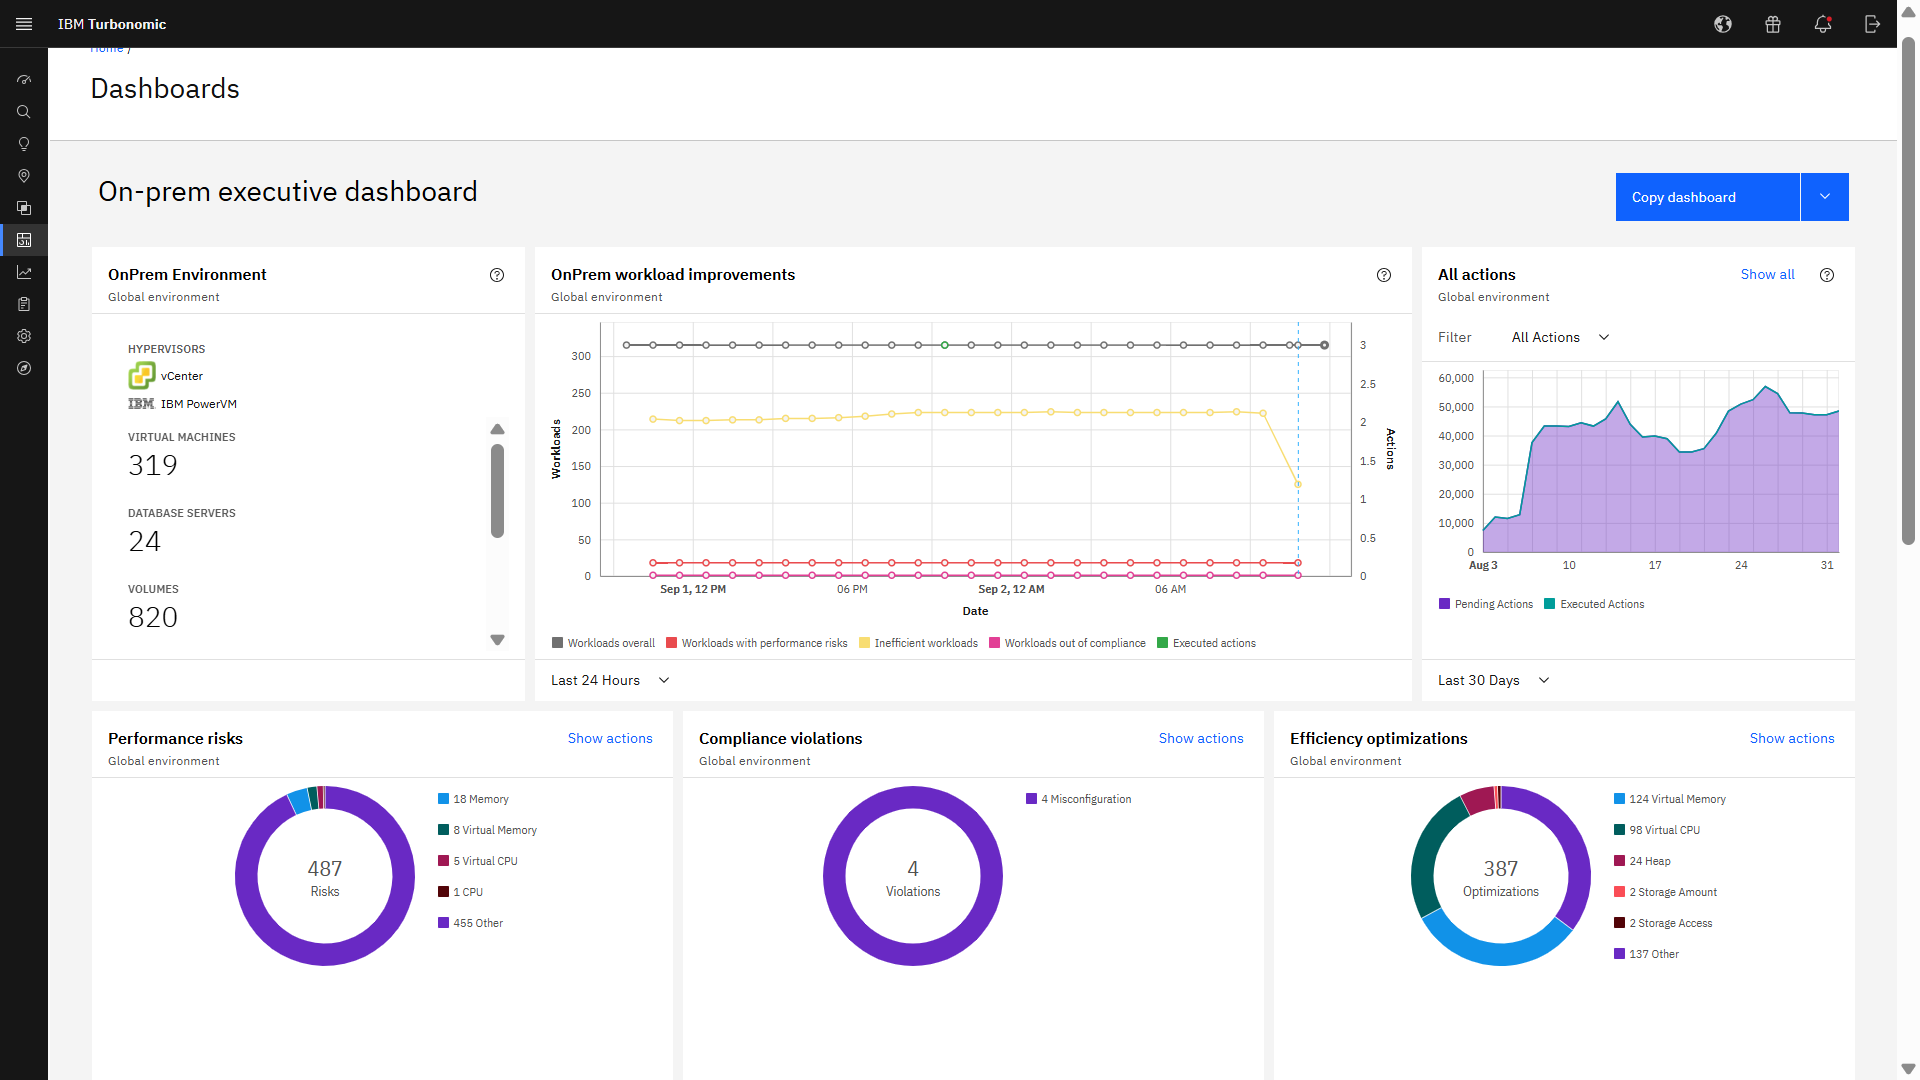
IBM Turbonomic is a performance and cost optimization platform for public, private, and hybrid clouds used by cloud, infrastructure operations, and architecture to assure application performance while eliminating inefficiencies by dynamically resourcing applications through automated actions. One of the key features of IBM Turbonomic is its ability to continuously adjust application resources in real time. By monitoring resource utilization and application performance,…
N/A
Pricing
Amazon CloudWatch
IBM Turbonomic
Editions & Modules
Canaries
$0.0012
per canary run
Logs - Analyze (Logs Insights queries)
$0.005
per GB of data scanned
Over 1,000,000 Metrics
$0.02
per month
Contributor Insights - Matched Log Events
$0.02
per month per one million log events that match the rule
Logs - Store (Archival)
$0.03
per GB
Next 750,000 Metrics
$0.05
per month
Next 240,000 Metrics
$0.10
per month
Alarm - Standard Resolution (60 Sec)
$0.10
per month per alarm metric
First 10,000 Metrics
$0.30
per month
Alarm - High Resolution (10 Sec)
$0.30
per month per alarm metric
Alarm - Composite
$0.50
per month per alarm
Logs - Collect (Data Ingestion)
$0.50
per GB
Contributor Insights
$0.50
per month per rule
Events - Custom
$1.00
per million events
Events - Cross-account
$1.00
per million events
CloudWatch RUM
$1
per 100k events
Dashboard
$3.00
per month per dashboard
CloudWatch Evidently - Events
$5
per 1 million events
CloudWatch Evidently - Analysis Units
$7.50
per 1 million analysis units
IBM® Turbonomic On-Prem
Varies - Request a Quote
per month IBM Turbonomic On-prem optimizes data center resources in real time, ensuring app performance at the lowest cost by aligning infrastructure supply with dynamic application demand.
IBM® Turbonomic Cloud Standard
Varies - Request a Quote
per month For customers with more than USD 1.6 million in annual cloud spend or 50 Managed Virtual Servers (MVS) or greater
IBM® Turbonomic Hybrid Standard
Varies - Request a Quote
per month Advanced hybrid cloud optimization capabilities for customers with 200 managed virtual servers (MVS) or more
Offerings
Pricing Offerings
Amazon CloudWatch
IBM Turbonomic
Free Trial
Yes
Yes
Free/Freemium Version
Yes
No
Premium Consulting/Integration Services
Yes
Yes
Entry-level Setup Fee
No setup fee
Optional
Additional Details
With Amazon CloudWatch, there is no up-front commitment or minimum fee; you simply pay for what you use. You will be charged at the end of the month for your usage.
Volume discounting available.
More Pricing Information
Community Pulse
Amazon CloudWatch
IBM Turbonomic
Considered Both Products
Amazon AWS
No answer on this topic
IBM
Verified User
Chose IBM Turbonomic
IBM Turbonomic supports multi cloud deployments and work well with other IBM cloud/web tools we use within our organization. While there is an initial learning curve, over long period of time it pays off once the cost benefits are realized from the efficiency gains. Given the …
A de minimis incentive was given to thank the reviewer for their time. The incentive was not used to bias or drive a particular response, nor was the incentive contingent on a positive endorsement. More Info
CIO (Chief Information Officer) in Information Technology at Ivory Education Private Limited (Education Management, 201-500 employees)
Chose IBM Turbonomic
Turbonomic is class apart compared to the others. It helps you achieve what is not possible with the other solutions. Turbonomic can work in an auto-mode and keep delivering savings and business performance. No other product comes even close.
A de minimis incentive was given to thank the reviewer for their time. The incentive was not used to bias or drive a particular response, nor was the incentive contingent on a positive endorsement. More Info
For out business we find that AWS Cloudwatch is good at providing real-time metrics for monitoring and analysing the performance and usage of our platform by customers. It is possible to create custom metrics from log events, such people adding items to a basket, checking out or abandoning their orders.
A de minimis incentive was given to thank the reviewer for their time. The incentive was not used to bias or drive a particular response, nor was the incentive contingent on a positive endorsement. More Info
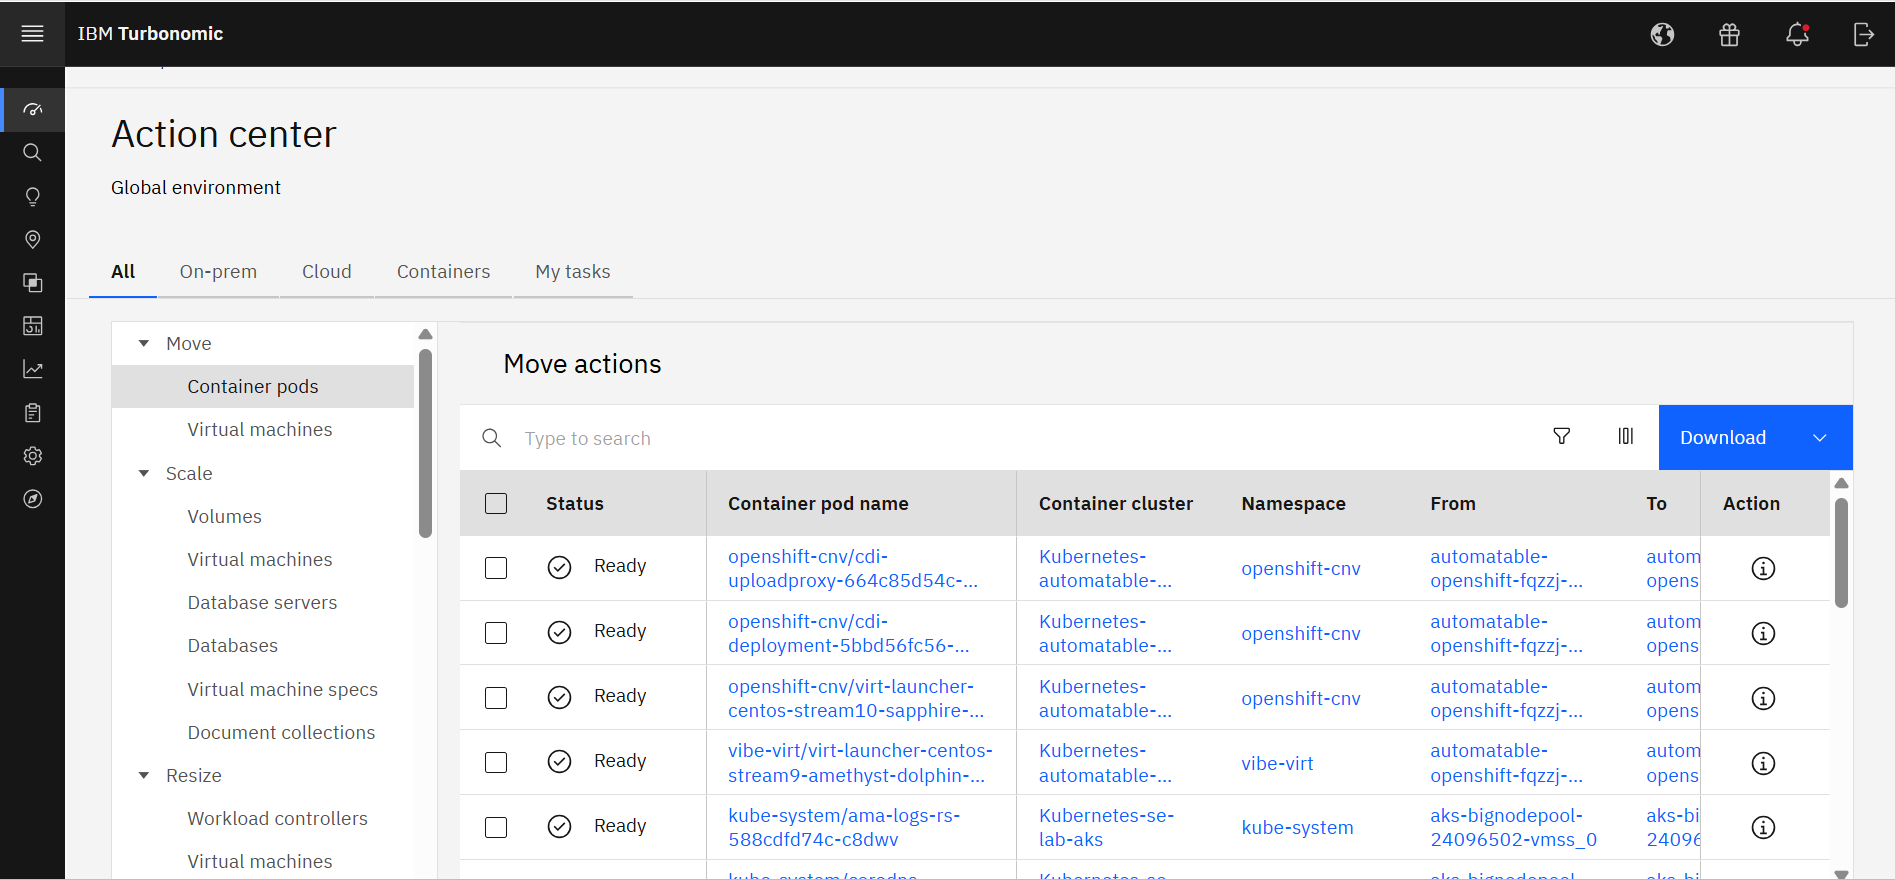
Measure the usage of resources across different platforms, from Kubernetes to VMs on-premises or in the cloud, to obtain current capacity metrics and plan for future scenarios. Reduce IT infrastructure costs by taking automated actions based on resource underutilization, such as shutting down VMs or changing resource definitions.
A de minimis incentive was given to thank the reviewer for their time. The incentive was not used to bias or drive a particular response, nor was the incentive contingent on a positive endorsement. More Info
It provides lot many out of the box dashboard to observe the health and usage of your cloud deployments. Few examples are CPU usage, Disk read/write, Network in/out etc.
It is possible to stream CloudWatch log data to Amazon Elasticsearch to process them almost real time.
If you have setup your code pipeline and wants to see the status, CloudWatch really helps. It can trigger lambda function when certain cloudWatch event happens and lambda can store the data to S3 or Athena which Quicksight can represent.
A de minimis incentive was given to thank the reviewer for their time. The incentive was not used to bias or drive a particular response, nor was the incentive contingent on a positive endorsement. More Info
A de minimis incentive was given to thank the reviewer for their time. The incentive was not used to bias or drive a particular response, nor was the incentive contingent on a positive endorsement. More Info
Memory metrics on EC2 are not available on CloudWatch. Depending on workloads if we need visibility on memory metrics we use Solarwinds Orion with the agent installed. For scalable workloads, this involves customization of images being used.
Visualization out of the box. But this can easily be addressed with other solutions such as Grafana.
By design, this is only used for AWS workloads so depending on your environment cannot be used as an all in one solution for your monitoring.
A de minimis incentive was given to thank the reviewer for their time. The incentive was not used to bias or drive a particular response, nor was the incentive contingent on a positive endorsement. More Info
It would be nice if the UI included a break-down of features that are both licensed as well as un-licensed. That way, you could not only see what you have, but what you don't.
The right-sizing recommendations are great, but very little info is given about why the recommendation is being made. More info would not only increase understanding, but would also help drive decision-making.
A de minimis incentive was given to thank the reviewer for their time. The incentive was not used to bias or drive a particular response, nor was the incentive contingent on a positive endorsement. More Info
We are certainly happy with Turbonomic as a whole and have invested quite a bit of time and effort into learning the ins and outs of the product. We have our reporting setup the way we want it and have gained definite value from these features. I will say though that many products nowadays are offering more native monitoring, reporting, and alerting features which may eventually steer us away from this product
A de minimis incentive was given to thank the reviewer for their time. The incentive was not used to bias or drive a particular response, nor was the incentive contingent on a positive endorsement. More Info
It's excellent at collecting logs. It's easy to set up. The viewing & querying part could be much better, though. The query syntax takes some time to get used to, & the examples are not helpful. Also, while being great, Log Insights requires manual picking of log streams to query across every time.
A de minimis incentive was given to thank the reviewer for their time. The incentive was not used to bias or drive a particular response, nor was the incentive contingent on a positive endorsement. More Info
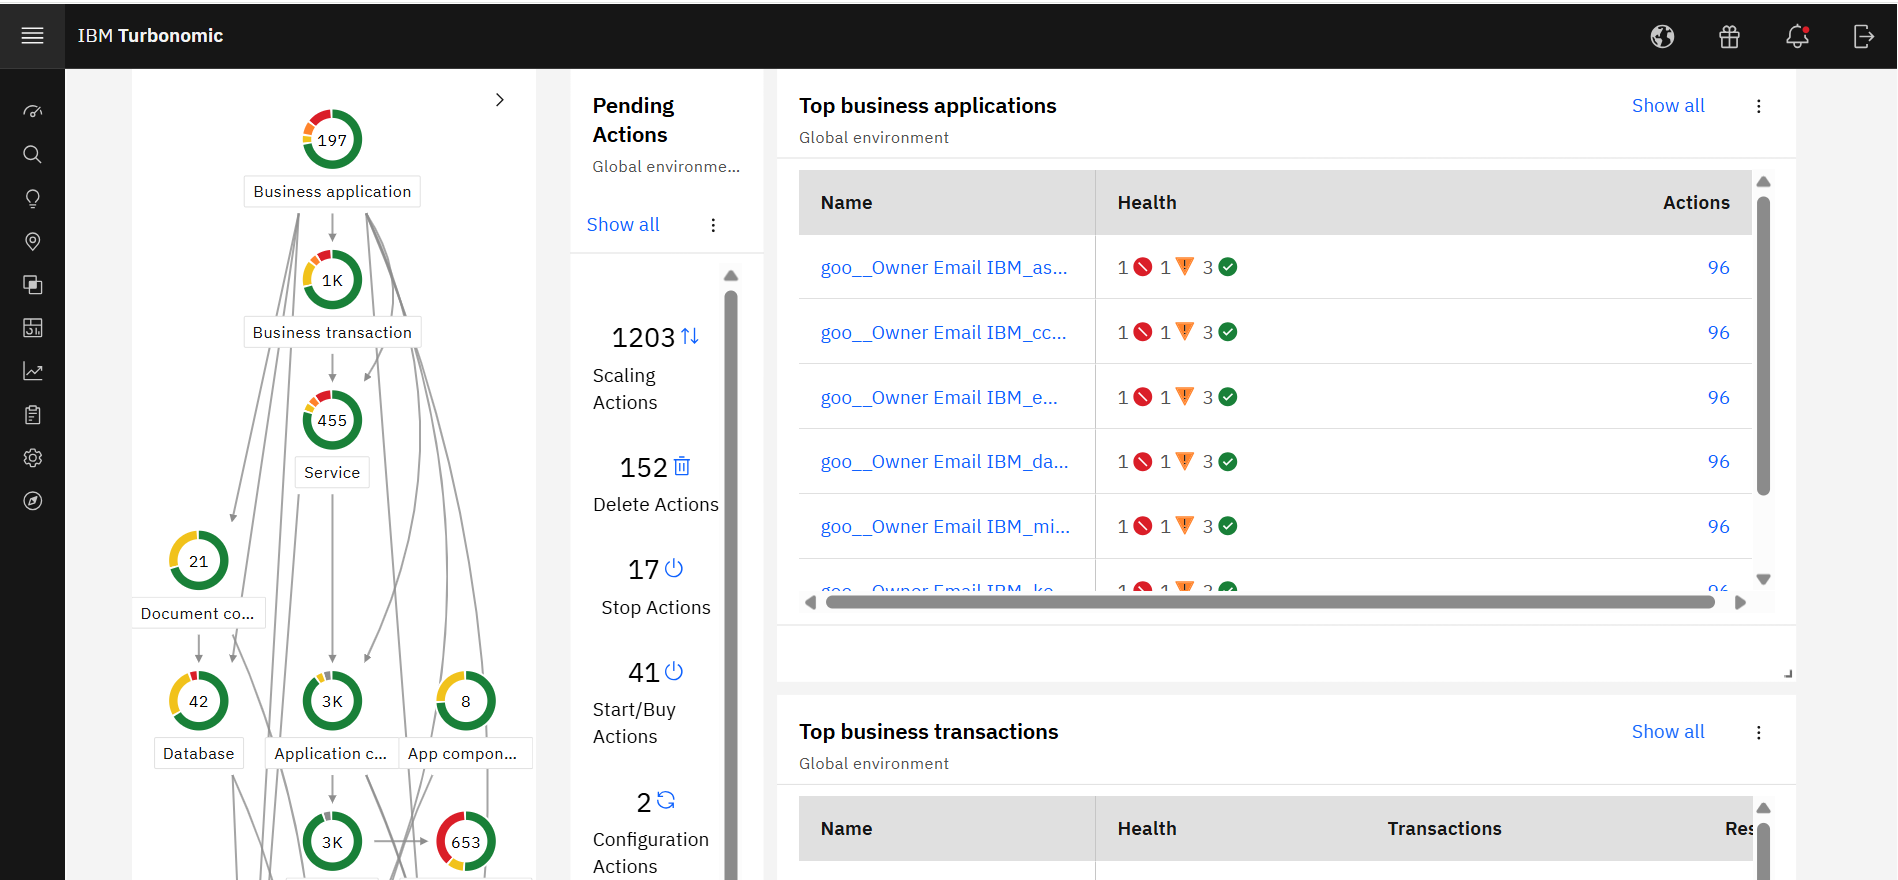
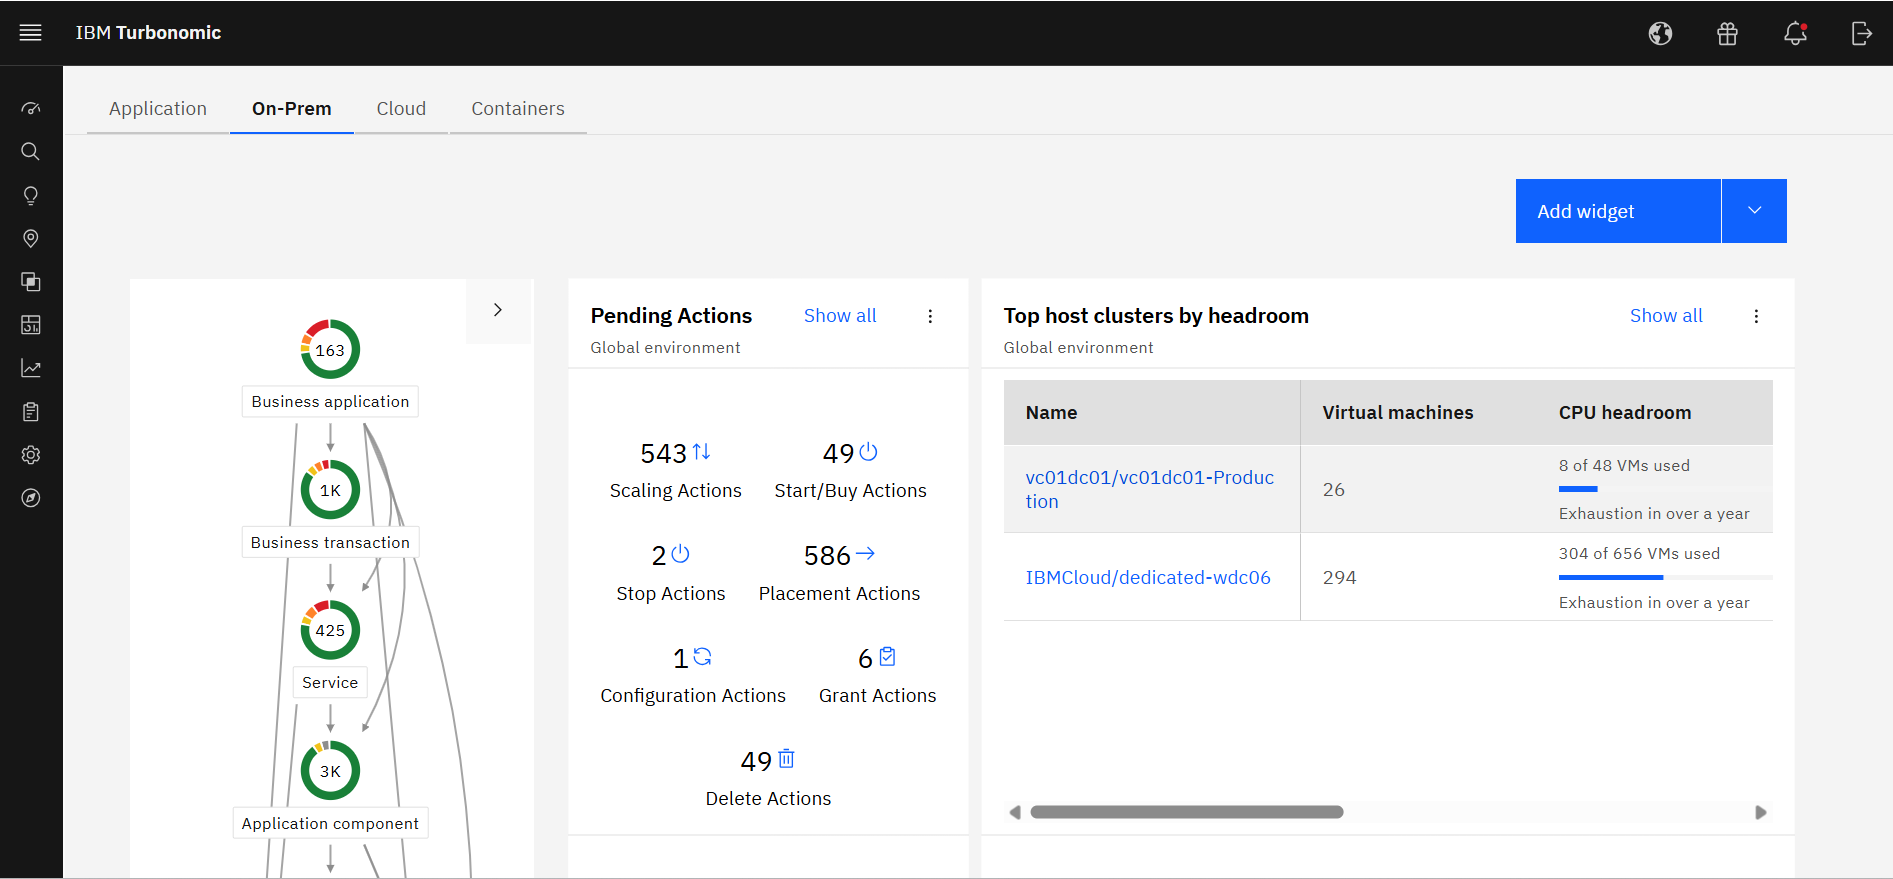
Excellent approach to larger VM organizational management. They have an very clean integrated dashboard that allows us to see everything in our environment and what that is doing in real-time. It works on multiple hyper-visors really well and integrates capacity planning on my local site as well as my cloud locations.
A de minimis incentive was given to thank the reviewer for their time. The incentive was not used to bias or drive a particular response, nor was the incentive contingent on a positive endorsement. TR verified that a representative sample of customers was invited. More Info
A de minimis incentive was given to thank the reviewer for their time. The incentive was not used to bias or drive a particular response, nor was the incentive contingent on a positive endorsement. TR verified that a representative sample of customers was invited. More Info
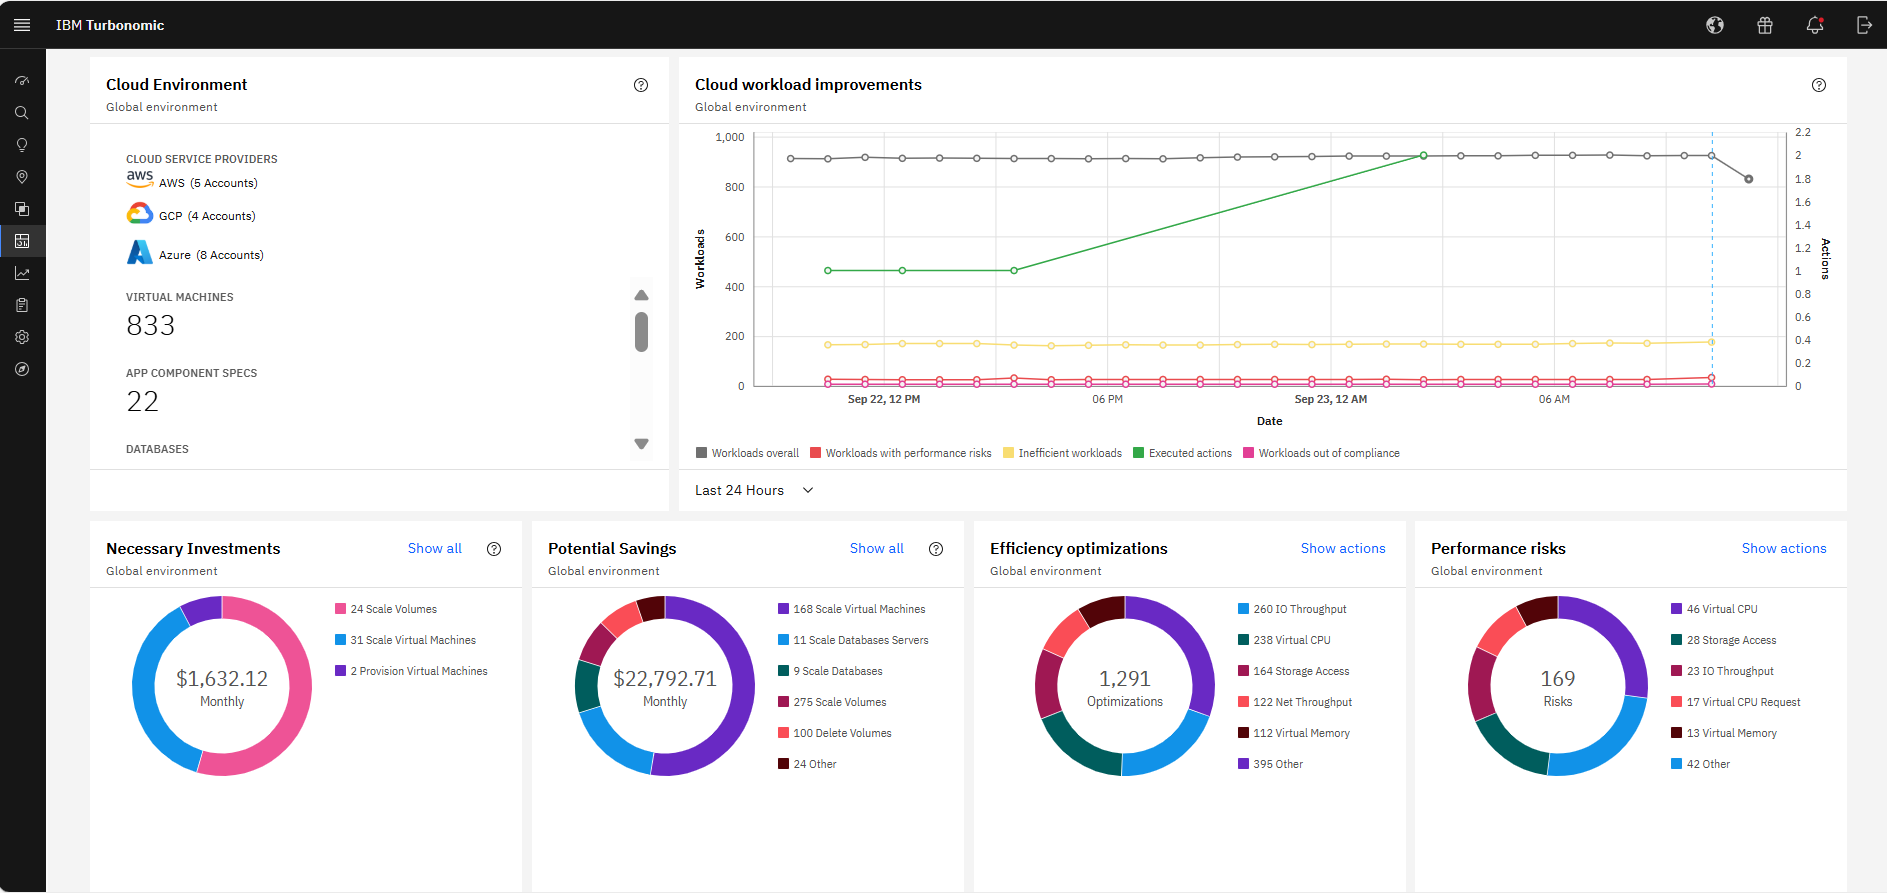
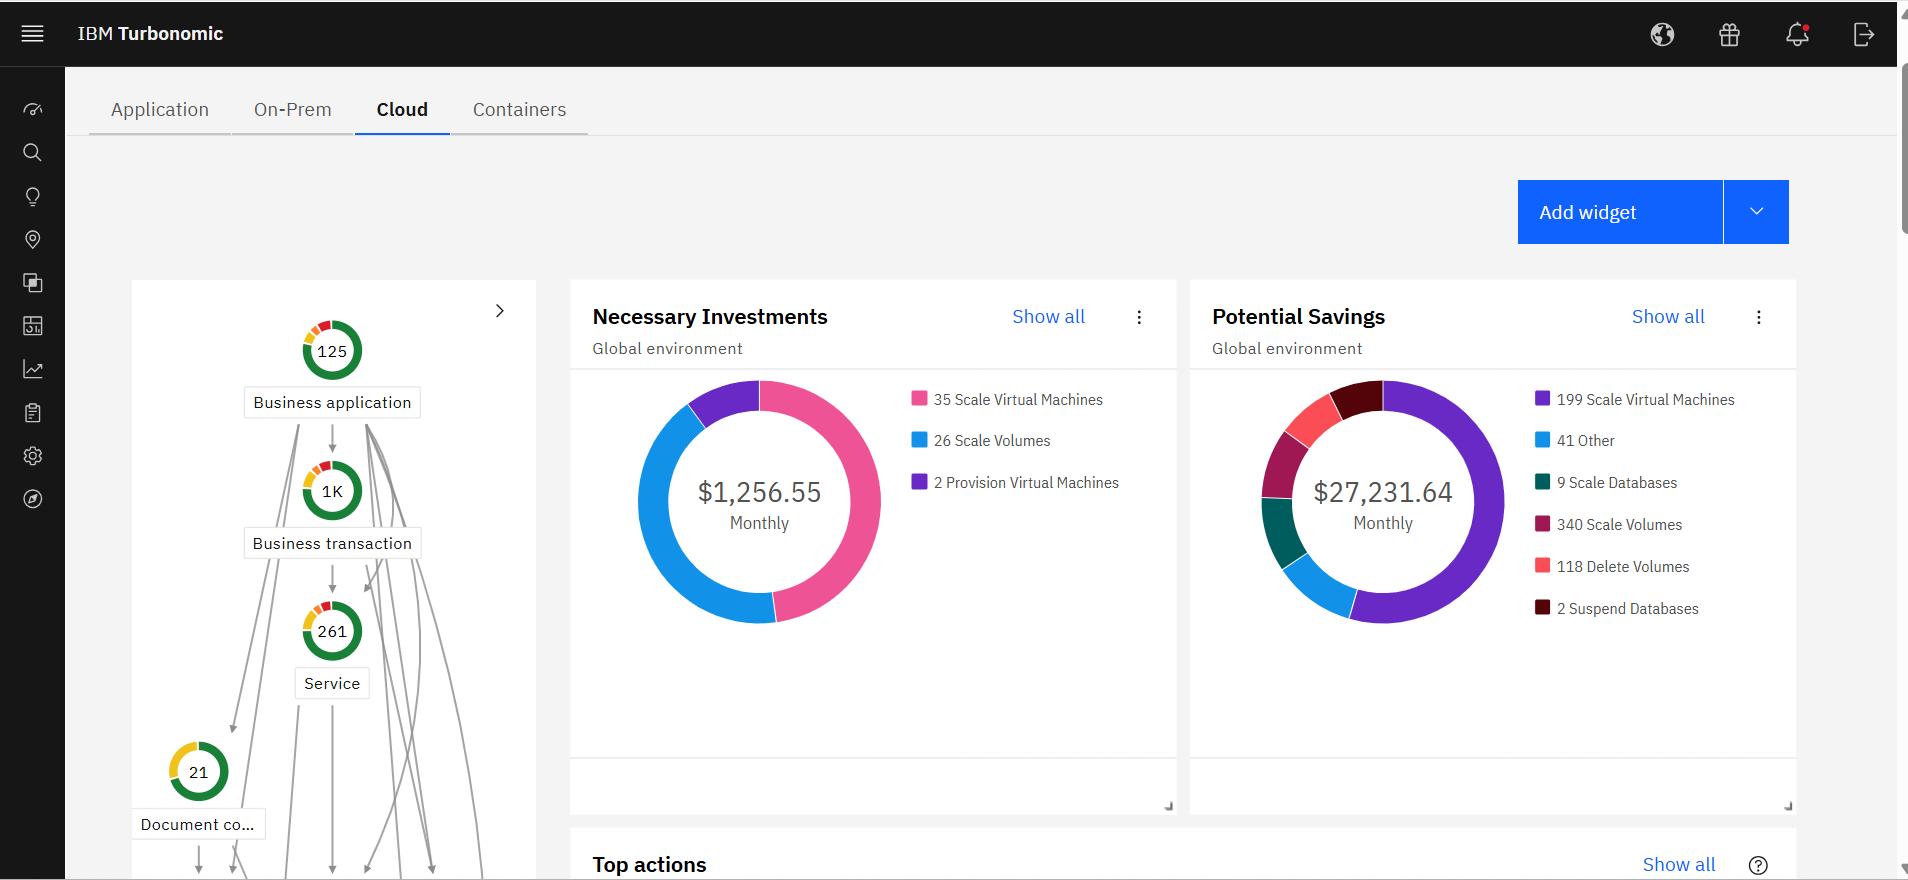
It allocates resources among applications by showing more on the cost breakdown by cloud service, with metrics on cloud provider information like Azure Management, Identity, Networking, Storage with costs per day, and total services costs. This then could facilitate and show the corresponding actions thereafter upon scaling.
A de minimis incentive was given to thank the reviewer for their time. The incentive was not used to bias or drive a particular response, nor was the incentive contingent on a positive endorsement. More Info
Support is effective, and we were able to get any problems that we couldn't get solved through community discussion forums solved for us by the AWS support team. For example, we were assisted in one instance where we were not sure about the best metrics to use in order to optimize an auto-scaling group on EC2. The support team was able to look at our metrics and give a useful recommendation on which metrics to use.
A de minimis incentive was given to thank the reviewer for their time. The incentive was not used to bias or drive a particular response, nor was the incentive contingent on a positive endorsement. More Info
When I contact support I get a quick response and they are able to solve my problem quickly. I also get a sense that they want to make sure that we are getting value from the product and walk me through whatever steps are needed to accomplish my goals.
A de minimis incentive was given to thank the reviewer for their time. The incentive was not used to bias or drive a particular response, nor was the incentive contingent on a positive endorsement. TR verified that a representative sample of customers was invited. More Info
Alex (from VMTurbo) has worked with the product for years and helped develop the product. He was very knowledgeable and was able to provide our support team with details knowledge on how to get our deployment configured correctly as well as help with another VMTurbo POC within another customers environment.
A de minimis incentive was given to thank the reviewer for their time. The incentive was not used to bias or drive a particular response, nor was the incentive contingent on a positive endorsement. TR verified that a representative sample of customers was invited. More Info
After buying VMTurbo Operations Manager, I was invited to an online user training event. I felt this training was effective and dug just deep enough to be informative yet still keep my attention. Additionally, the webinar was free.
A de minimis incentive was given to thank the reviewer for their time. The incentive was not used to bias or drive a particular response, nor was the incentive contingent on a positive endorsement. TR verified that a representative sample of customers was invited. More Info
The implementation was very simple. Just upload an OVA file and power on the VM. Once it comes up enter some networking information and you can then access the web interface. From there, just begin configuring the system for your environment by adding you license and the various virtual environments and storage through the inventory tab
A de minimis incentive was given to thank the reviewer for their time. The incentive was not used to bias or drive a particular response, nor was the incentive contingent on a positive endorsement. TR verified that a representative sample of customers was invited. More Info
Grafana is definitely a lot better and flexible in comparison with Amazon CloudWatch for visualisation, as it offers much more options and is versatile. VictoriaMetrics and Prometheus are time-series databases which can do almost everything cloudwatch can do in a better and cheaper way. Integrating Grafana with them will make it more capable Elasticsearch for log retention and querying will surpass cloudwatch log monitoring in both performance and speed
A de minimis incentive was given to thank the reviewer for their time. The incentive was not used to bias or drive a particular response, nor was the incentive contingent on a positive endorsement. More Info
As the organization had experience of years in using IBM products, we had the confidence that they will provide us with great support. And we needed a reliable solution as a financial institute to ensure continuous operations. Even though the price was very high, we made the correct decision to go ahead with IBM Turbonomic as the feedback from existing users in the region was very positive. We needed a solution which was capable of handling our automation requirements. All these were green in IBM Turbonomic.
A de minimis incentive was given to thank the reviewer for their time. The incentive was not used to bias or drive a particular response, nor was the incentive contingent on a positive endorsement. More Info
A de minimis incentive was given to thank the reviewer for their time. The incentive was not used to bias or drive a particular response, nor was the incentive contingent on a positive endorsement. More Info
Professional services were always there to guide us in our transformation to the cloud. They understood our business model and then were able to provide guidance on what we needed from the tool.
A de minimis incentive was given to thank the reviewer for their time. The incentive was not used to bias or drive a particular response, nor was the incentive contingent on a positive endorsement. More Info
A de minimis incentive was given to thank the reviewer for their time. The incentive was not used to bias or drive a particular response, nor was the incentive contingent on a positive endorsement. More Info
Application performance has been a big one. With Turbonomic keeping everything running at top performance, it can make changes when extra resources are need, quicker than somebody being notified and then making the necessary changes.
Turbonomic has been a great cost savings for us on multiple occasions. We use it every time we are improving servers.
With the planning feature we get the best performance form new hardware purchases
A de minimis incentive was given to thank the reviewer for their time. The incentive was not used to bias or drive a particular response, nor was the incentive contingent on a positive endorsement. More Info