Amazon CloudWatch is a native AWS monitoring tool for AWS programs. It provides data collection and resource monitoring capabilities.
$0
per canary run
TrackJS
Score 8.0 out of 10
N/A
TrackJS is an error monitoring service for web applications. It provides enhanced stack traces and detailed telemetry for developers to understand how an error happened, how to recreate it, and how to fix it.
N/A
Pricing
Amazon CloudWatch
TrackJS
Editions & Modules
Canaries
$0.0012
per canary run
Logs - Analyze (Logs Insights queries)
$0.005
per GB of data scanned
Over 1,000,000 Metrics
$0.02
per month
Contributor Insights - Matched Log Events
$0.02
per month per one million log events that match the rule
Logs - Store (Archival)
$0.03
per GB
Next 750,000 Metrics
$0.05
per month
Next 240,000 Metrics
$0.10
per month
Alarm - Standard Resolution (60 Sec)
$0.10
per month per alarm metric
First 10,000 Metrics
$0.30
per month
Alarm - High Resolution (10 Sec)
$0.30
per month per alarm metric
Alarm - Composite
$0.50
per month per alarm
Logs - Collect (Data Ingestion)
$0.50
per GB
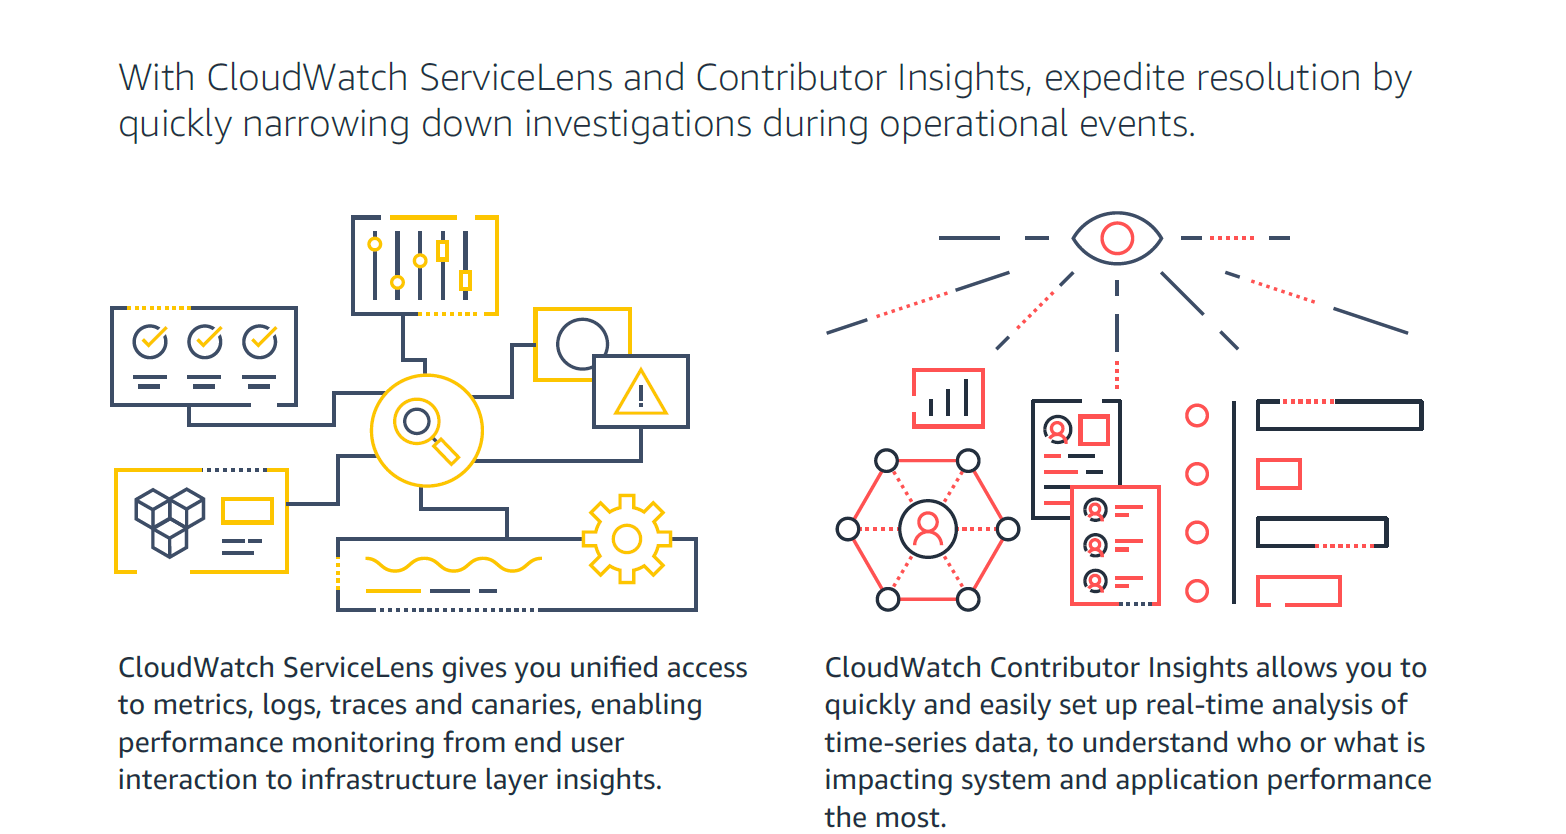
Contributor Insights
$0.50
per month per rule
Events - Custom
$1.00
per million events
Events - Cross-account
$1.00
per million events
CloudWatch RUM
$1
per 100k events
Dashboard
$3.00
per month per dashboard
CloudWatch Evidently - Events
$5
per 1 million events
CloudWatch Evidently - Analysis Units
$7.50
per 1 million analysis units
No answers on this topic
Offerings
Pricing Offerings
Amazon CloudWatch
TrackJS
Free Trial
Yes
Yes
Free/Freemium Version
Yes
No
Premium Consulting/Integration Services
No
No
Entry-level Setup Fee
No setup fee
$49 monthly page views
Additional Details
With Amazon CloudWatch, there is no up-front commitment or minimum fee; you simply pay for what you use. You will be charged at the end of the month for your usage.
—
More Pricing Information
Community Pulse
Amazon CloudWatch
TrackJS
Features
Amazon CloudWatch
TrackJS
Application Performance Management
Comparison of Application Performance Management features of Product A and Product B
If you use any AWS services, CloudWatch is the natural choice to monitor & troubleshoot your workload. Thankfully, for most AWS services, CloudWatch is either built-in or very easy to set up. However, being proficient in browsing & tracking the log events would take some training & practice. Having some experienced people on the team would help immensely, especially in spreading the skill to the rest of the team.
If you're not currently doing any JS error tracking or are just getting started, TrackJS is a great solution. If you are looking for a more technical solution, something like NewRelic may be more appropriate - but if the primary user isn't going to be a web developer and you're looking for something that is easier to use, I would recommend TrackJS.
It provides lot many out of the box dashboard to observe the health and usage of your cloud deployments. Few examples are CPU usage, Disk read/write, Network in/out etc.
It is possible to stream CloudWatch log data to Amazon Elasticsearch to process them almost real time.
If you have setup your code pipeline and wants to see the status, CloudWatch really helps. It can trigger lambda function when certain cloudWatch event happens and lambda can store the data to S3 or Athena which Quicksight can represent.
Memory metrics on EC2 are not available on CloudWatch. Depending on workloads if we need visibility on memory metrics we use Solarwinds Orion with the agent installed. For scalable workloads, this involves customization of images being used.
Visualization out of the box. But this can easily be addressed with other solutions such as Grafana.
By design, this is only used for AWS workloads so depending on your environment cannot be used as an all in one solution for your monitoring.
Although the tool itself is easy to integrate and is readily available for use, it has its limitations. The key limitations of cloudwatch are with respect to cost incurred on log retention and log querying. While for key use cases this is sufficient, for more advanced use cases, Amazon CloudWatch doesn't work out. Also, obviously it is tightly coupled with AWS, which makes you look away if you need a single tool for all monitoring
Support is effective, and we were able to get any problems that we couldn't get solved through community discussion forums solved for us by the AWS support team. For example, we were assisted in one instance where we were not sure about the best metrics to use in order to optimize an auto-scaling group on EC2. The support team was able to look at our metrics and give a useful recommendation on which metrics to use.
We use Cloudwatch for simpler monitoring, but these metrics and logs often feed into bigger ecosystems across our organization. The metrics and logs in Cloudwatch allow our developers quick and easy access to the data they need whilst easily integrating the same data into more prominent platforms for wider analysis, including Service desk support, SecOps, and ITOps monitoring within the organization.