Amazon CloudWatch vs. OpsCompass
Amazon CloudWatch vs. OpsCompass
| Product | Rating | Most Used By | Product Summary | Starting Price |
|---|---|---|---|---|
 Amazon CloudWatch | N/A | Amazon CloudWatch is a native AWS monitoring tool for AWS programs. It provides data collection and resource monitoring capabilities. | $0 per canary run | |
 OpsCompass | N/A | OpsCompass is an enterprise-ready cloud security management software that drives multi-cloud operational control, visibility, and security to Microsoft Azure, AWS, and Google Cloud Platform. Its UI is designed to provide clear data visualization for resource management, remediation, and configuration drift management. OpsCompass utilizes CIS SecureSuite benchmarks as industry-accepted system hardening standards, and are used by organizations in meeting compliance requirements for FISMA, PCI DSS,… | $0 |
| Amazon CloudWatch | OpsCompass | |||||||||||||||
|---|---|---|---|---|---|---|---|---|---|---|---|---|---|---|---|---|
| Editions & Modules |
|
| ||||||||||||||
| Offerings |
| |||||||||||||||
| Entry-level Setup Fee | No setup fee | No setup fee | ||||||||||||||
| Additional Details | With Amazon CloudWatch, there is no up-front commitment or minimum fee; you simply pay for what you use. You will be charged at the end of the month for your usage. | — | ||||||||||||||
| More Pricing Information | ||||||||||||||||
| Amazon CloudWatch | OpsCompass |
|---|
| Amazon CloudWatch | OpsCompass | ||||||||||||||||||
|---|---|---|---|---|---|---|---|---|---|---|---|---|---|---|---|---|---|---|---|
| Cloud Management |
|
| Amazon CloudWatch | OpsCompass | |
|---|---|---|
| Small Businesses |  InfluxDB Score 8.8 out of 10 |  VMware Cloud Director Score 8.5 out of 10 |
| Medium-sized Companies |  Logz.io Score 7.0 out of 10 |  IBM Turbonomic Score 9.2 out of 10 |
| Enterprises |  NetBrain Technologies Score 9.1 out of 10 |  vRealize Operations (discontinued) Score 9.9 out of 10 |
| All Alternatives | View all alternatives | View all alternatives |
| Amazon CloudWatch | OpsCompass | |
|---|---|---|
| Likelihood to Recommend | 7.7 (40 ratings) | 8.2 (2 ratings) |
| Usability | 7.0 (3 ratings) | - (0 ratings) |
| Support Rating | 8.4 (8 ratings) | - (0 ratings) |
| Amazon CloudWatch | OpsCompass | |
|---|---|---|
| Likelihood to Recommend | Amazon AWS
| OpsCompass Inc
 Dan Schoenbaum Managing Partner |
| Pros | Amazon AWS
 Apurv Doshi Senior Solutions Architect | OpsCompass Inc
 Mark Beavers Technology Advisor |
| Cons | Amazon AWS
| OpsCompass Inc
Dan Schoenbaum Managing Partner |
| Usability | Amazon AWS
| OpsCompass Inc No answers on this topic |
| Support Rating | Amazon AWS
 Ramindu Deshapriya Lead Consultant - Technology | OpsCompass Inc No answers on this topic |
| Alternatives Considered | Amazon AWS
| OpsCompass Inc
Mark Beavers Technology Advisor |
| Return on Investment | Amazon AWS
 Rob Domenico Senior Systems Administrator | OpsCompass Inc
Dan Schoenbaum Managing Partner |
| ScreenShots | Amazon CloudWatch Screenshots     | OpsCompass Screenshots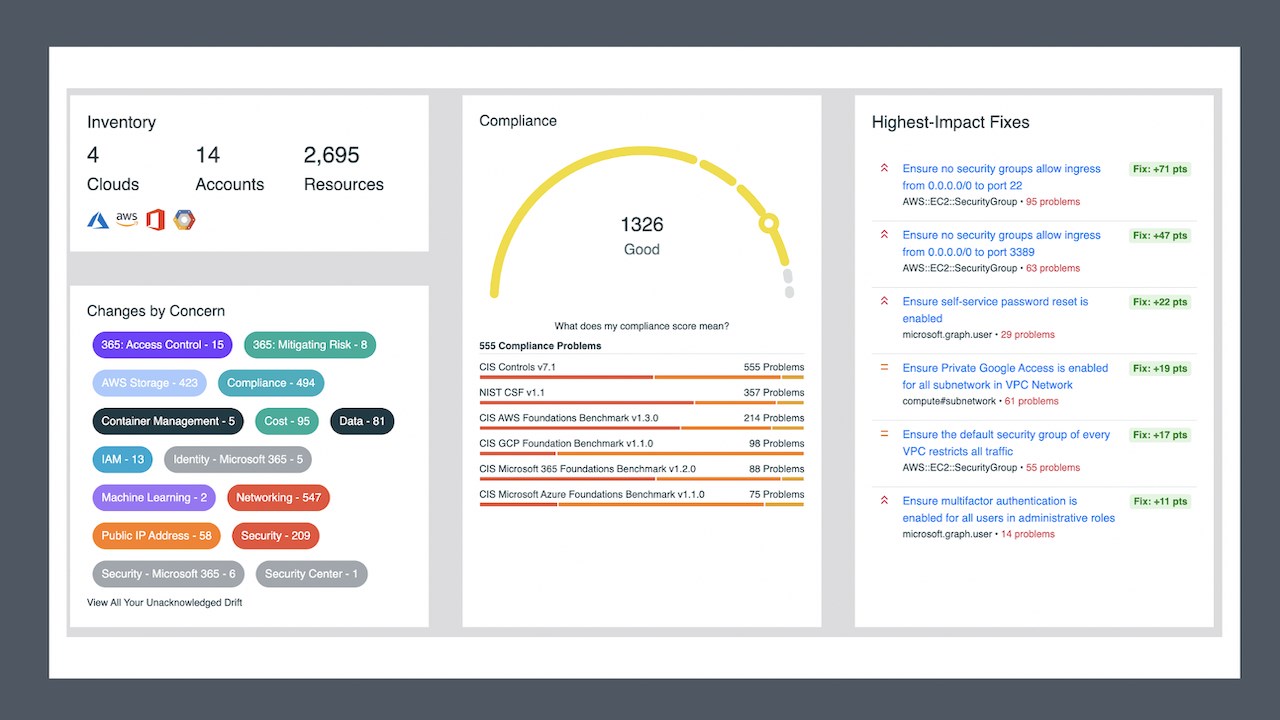   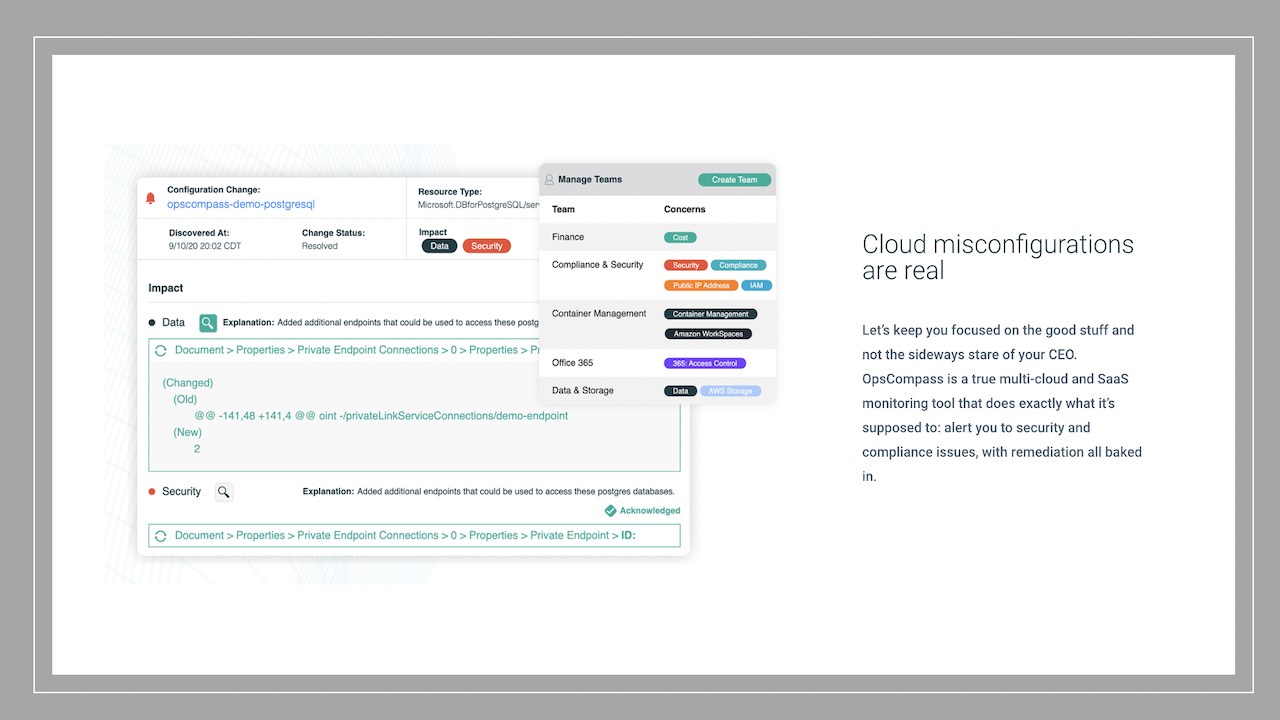  |