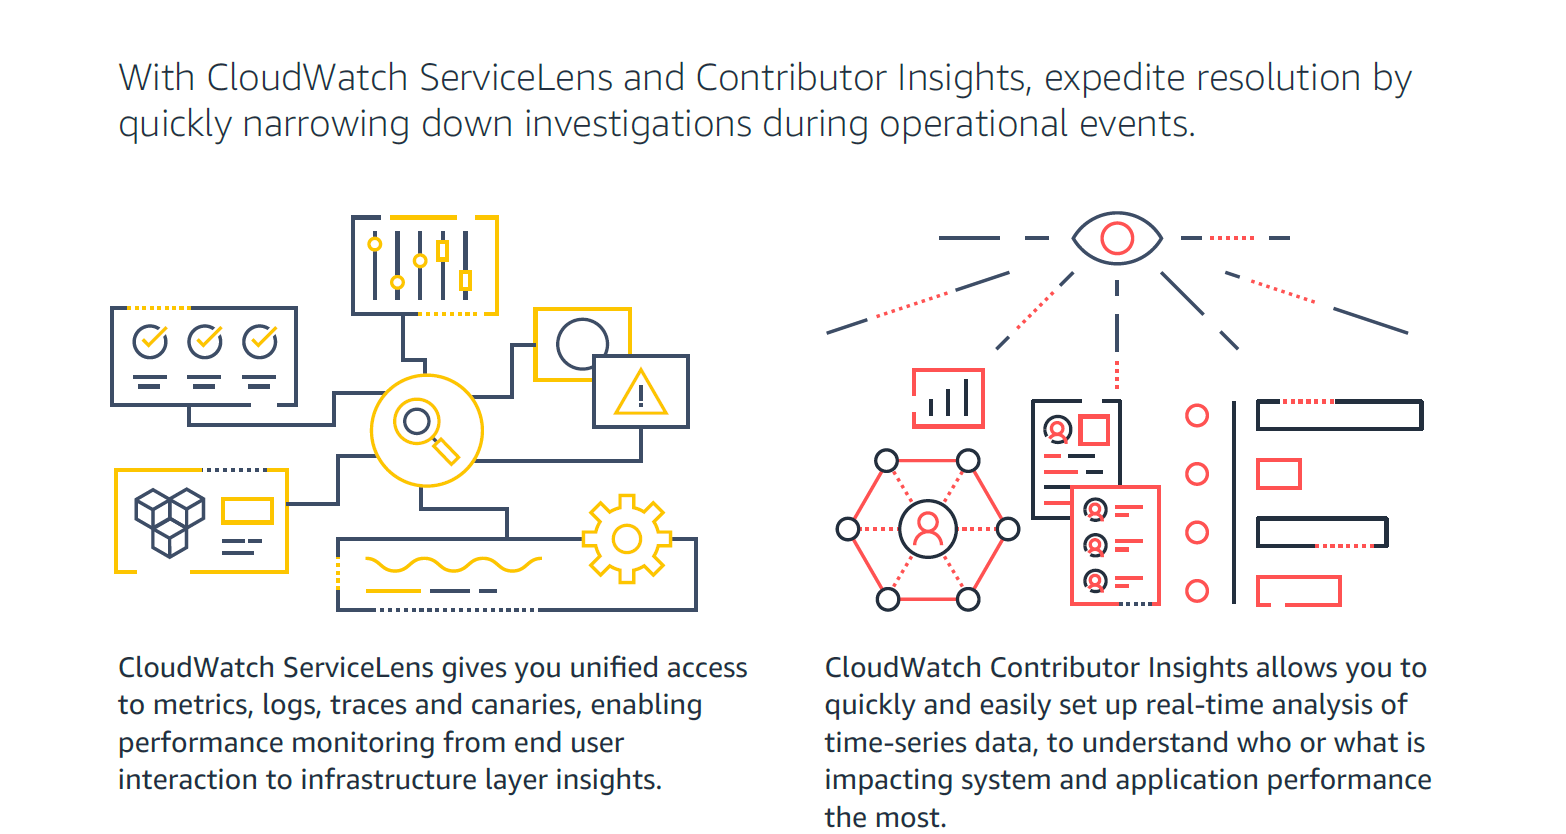
Amazon CloudWatch is a native AWS monitoring tool for AWS programs. It provides data collection and resource monitoring capabilities.
$0
per canary run
Elasticsearch
Score8.6 out of 10
N/A
Elasticsearch is an enterprise search tool from Elastic in Mountain View, California.
$16
per month
Pricing
Amazon CloudWatch
Elasticsearch
Editions & Modules
Canaries
$0.0012
per canary run
Logs - Analyze (Logs Insights queries)
$0.005
per GB of data scanned
Over 1,000,000 Metrics
$0.02
per month
Contributor Insights - Matched Log Events
$0.02
per month per one million log events that match the rule
Logs - Store (Archival)
$0.03
per GB
Next 750,000 Metrics
$0.05
per month
Next 240,000 Metrics
$0.10
per month
Alarm - Standard Resolution (60 Sec)
$0.10
per month per alarm metric
First 10,000 Metrics
$0.30
per month
Alarm - High Resolution (10 Sec)
$0.30
per month per alarm metric
Alarm - Composite
$0.50
per month per alarm
Logs - Collect (Data Ingestion)
$0.50
per GB
Contributor Insights
$0.50
per month per rule
Events - Custom
$1.00
per million events
Events - Cross-account
$1.00
per million events
CloudWatch RUM
$1
per 100k events
Dashboard
$3.00
per month per dashboard
CloudWatch Evidently - Events
$5
per 1 million events
CloudWatch Evidently - Analysis Units
$7.50
per 1 million analysis units
Standard
$16.00
per month
Gold
$19.00
per month
Platinum
$22.00
per month
Enterprise
Contact Sales
Offerings
Pricing Offerings
Amazon CloudWatch
Elasticsearch
Free Trial
Yes
No
Free/Freemium Version
Yes
No
Premium Consulting/Integration Services
Yes
No
Entry-level Setup Fee
No setup fee
No setup fee
Additional Details
With Amazon CloudWatch, there is no up-front commitment or minimum fee; you simply pay for what you use. You will be charged at the end of the month for your usage.
—
More Pricing Information
Community Pulse
Amazon CloudWatch
Elasticsearch
Considered Both Products
Amazon AWS
Verified User
Chose Amazon CloudWatch
Grafana is definitely a lot better and flexible in comparison with Amazon CloudWatch for visualisation, as it offers much more options and is versatile. VictoriaMetrics and Prometheus are time-series databases which can do almost everything cloudwatch can do in a better and …
A de minimis incentive was given to thank the reviewer for their time. The incentive was not used to bias or drive a particular response, nor was the incentive contingent on a positive endorsement. More Info
Verified User
Chose Amazon CloudWatch
I believe that CloudWatch is a better solution to use with AWS services and resources in terms of cost and ease of integration with AWS infrastructure services. But keep in mind that Elasticsearch is better at aggregating application-level metrics. We chose CloudWatch because of …
A de minimis incentive was given to thank the reviewer for their time. The incentive was not used to bias or drive a particular response, nor was the incentive contingent on a positive endorsement. More Info
Lead Consultant - Technology in Information Technology at Virtusa (Computer Software, 10,001+ employees)
Chose Amazon CloudWatch
We found that CloudWatch is the best solution to use with AWS services in terms of cost and ease of integration with AWS infrastructure services. While Elasticsearch is better at aggregating application-level metrics, CloudWatch wins out in its capabilities to tightly integrate …
A de minimis incentive was given to thank the reviewer for their time. The incentive was not used to bias or drive a particular response, nor was the incentive contingent on a positive endorsement. More Info
A de minimis incentive was given to thank the reviewer for their time. The incentive was not used to bias or drive a particular response, nor was the incentive contingent on a positive endorsement. More Info
A de minimis incentive was given to thank the reviewer for their time. The incentive was not used to bias or drive a particular response, nor was the incentive contingent on a positive endorsement. More Info
Verified User
Chose Amazon CloudWatch
Amazon CloudWatch is fully integrated into your existing AWS account, and provides easy hooks into several different services to make a cohesive infrastructure. Unfortunately, using other services will not allow you to get into the weeds to do everything Amazon CloudWatch can …
A de minimis incentive was given to thank the reviewer for their time. The incentive was not used to bias or drive a particular response, nor was the incentive contingent on a positive endorsement. More Info
Verified User
Chose Amazon CloudWatch
I feel that CloudWatch will always remain the backbone of log analytics, events, and alarms. However, we can use other products in conjunction with it for better log analytics and monitoring. In my organization, we also ingest logs from CloudWatch to Splunk and ELK. This way we …
A de minimis incentive was given to thank the reviewer for their time. The incentive was not used to bias or drive a particular response, nor was the incentive contingent on a positive endorsement. More Info
A de minimis incentive was given to thank the reviewer for their time. The incentive was not used to bias or drive a particular response, nor was the incentive contingent on a positive endorsement. More Info
For out business we find that AWS Cloudwatch is good at providing real-time metrics for monitoring and analysing the performance and usage of our platform by customers. It is possible to create custom metrics from log events, such people adding items to a basket, checking out or abandoning their orders.
A de minimis incentive was given to thank the reviewer for their time. The incentive was not used to bias or drive a particular response, nor was the incentive contingent on a positive endorsement. More Info
Elasticsearch is a really scalable solution that can fit a lot of needs, but the bigger and/or those needs become, the more understanding & infrastructure you will need for your instance to be running correctly. Elasticsearch is not problem-free - you can get yourself in a lot of trouble if you are not following good practices and/or if are not managing the cluster correctly. Licensing is a big decision point here as Elasticsearch is a middleware component - be sure to read the licensing agreement of the version you want to try before you commit to it. Same goes for long-term support - be sure to keep yourself in the know for this aspect you may end up stuck with an unpatched version for years.
A de minimis incentive was given to thank the reviewer for their time. The incentive was not used to bias or drive a particular response, nor was the incentive contingent on a positive endorsement. More Info
It provides lot many out of the box dashboard to observe the health and usage of your cloud deployments. Few examples are CPU usage, Disk read/write, Network in/out etc.
It is possible to stream CloudWatch log data to Amazon Elasticsearch to process them almost real time.
If you have setup your code pipeline and wants to see the status, CloudWatch really helps. It can trigger lambda function when certain cloudWatch event happens and lambda can store the data to S3 or Athena which Quicksight can represent.
A de minimis incentive was given to thank the reviewer for their time. The incentive was not used to bias or drive a particular response, nor was the incentive contingent on a positive endorsement. More Info
As I mentioned before, Elasticsearch's flexible data model is unparalleled. You can nest fields as deeply as you want, have as many fields as you want, but whatever you want in those fields (as long as it stays the same type), and all of it will be searchable and you don't need to even declare a schema beforehand!
Elastic, the company behind Elasticsearch, is super strong financially and they have a great team of devs and product managers working on Elasticsearch. When I first started using ES 3 years ago, I was 90% impressed and knew it would be a good fit. 3 years later, I am 200% impressed and blown away by how far it has come and gotten even better. If there are features that are missing or you don't think it's fast enough right now, I bet it'll be suitable next year because the team behind it is so dang fast!
Elasticsearch is really, really stable. It takes a lot to bring down a cluster. It's self-balancing algorithms, leader-election system, self-healing properties are state of the art. We've never seen network failures or hard-drive corruption or CPU bugs bring down an ES cluster.
A de minimis incentive was given to thank the reviewer for their time. The incentive was not used to bias or drive a particular response, nor was the incentive contingent on a positive endorsement. More Info
Memory metrics on EC2 are not available on CloudWatch. Depending on workloads if we need visibility on memory metrics we use Solarwinds Orion with the agent installed. For scalable workloads, this involves customization of images being used.
Visualization out of the box. But this can easily be addressed with other solutions such as Grafana.
By design, this is only used for AWS workloads so depending on your environment cannot be used as an all in one solution for your monitoring.
A de minimis incentive was given to thank the reviewer for their time. The incentive was not used to bias or drive a particular response, nor was the incentive contingent on a positive endorsement. More Info
A de minimis incentive was given to thank the reviewer for their time. The incentive was not used to bias or drive a particular response, nor was the incentive contingent on a positive endorsement. More Info
A de minimis incentive was given to thank the reviewer for their time. The incentive was not used to bias or drive a particular response, nor was the incentive contingent on a positive endorsement. More Info
It's excellent at collecting logs. It's easy to set up. The viewing & querying part could be much better, though. The query syntax takes some time to get used to, & the examples are not helpful. Also, while being great, Log Insights requires manual picking of log streams to query across every time.
A de minimis incentive was given to thank the reviewer for their time. The incentive was not used to bias or drive a particular response, nor was the incentive contingent on a positive endorsement. More Info
To get started with Elasticsearch, you don't have to get very involved in configuring what really is an incredibly complex system under the hood. You simply install the package, run the service, and you're immediately able to begin using it. You don't need to learn any sort of query language to add data to Elasticsearch or perform some basic searching. If you're used to any sort of RESTful API, getting started with Elasticsearch is a breeze. If you've never interacted with a RESTful API directly, the journey may be a little more bumpy. Overall, though, it's incredibly simple to use for what it's doing under the covers.
A de minimis incentive was given to thank the reviewer for their time. The incentive was not used to bias or drive a particular response, nor was the incentive contingent on a positive endorsement. More Info
Support is effective, and we were able to get any problems that we couldn't get solved through community discussion forums solved for us by the AWS support team. For example, we were assisted in one instance where we were not sure about the best metrics to use in order to optimize an auto-scaling group on EC2. The support team was able to look at our metrics and give a useful recommendation on which metrics to use.
A de minimis incentive was given to thank the reviewer for their time. The incentive was not used to bias or drive a particular response, nor was the incentive contingent on a positive endorsement. More Info
We've only used it as an opensource tooling. We did not purchase any additional support to roll out the elasticsearch software. When rolling out the application on our platform we've used the documentation which was available online. During our test phases we did not experience any bugs or issues so we did not rely on support at all.
A de minimis incentive was given to thank the reviewer for their time. The incentive was not used to bias or drive a particular response, nor was the incentive contingent on a positive endorsement. More Info
A de minimis incentive was given to thank the reviewer for their time. The incentive was not used to bias or drive a particular response, nor was the incentive contingent on a positive endorsement. More Info
Grafana is definitely a lot better and flexible in comparison with Amazon CloudWatch for visualisation, as it offers much more options and is versatile. VictoriaMetrics and Prometheus are time-series databases which can do almost everything cloudwatch can do in a better and cheaper way. Integrating Grafana with them will make it more capable Elasticsearch for log retention and querying will surpass cloudwatch log monitoring in both performance and speed
A de minimis incentive was given to thank the reviewer for their time. The incentive was not used to bias or drive a particular response, nor was the incentive contingent on a positive endorsement. More Info
As far as we are concerned, Elasticsearch is the gold standard and we have barely evaluated any alternatives. You could consider it an alternative to a relational or NoSQL database, so in cases where those suffice, you don't need Elasticsearch. But if you want powerful text-based search capabilities across large data sets, Elasticsearch is the way to go.
A de minimis incentive was given to thank the reviewer for their time. The incentive was not used to bias or drive a particular response, nor was the incentive contingent on a positive endorsement. More Info
A de minimis incentive was given to thank the reviewer for their time. The incentive was not used to bias or drive a particular response, nor was the incentive contingent on a positive endorsement. More Info
We have had great luck with implementing Elasticsearch for our search and analytics use cases.
While the operational burden is not minimal, operating a cluster of servers, using a custom query language, writing Elasticsearch-specific bulk insert code, the performance and the relative operational ease of Elasticsearch are unparalleled.
We've easily saved hundreds of thousands of dollars implementing Elasticsearch vs. RDBMS vs. other no-SQL solutions for our specific set of problems.
A de minimis incentive was given to thank the reviewer for their time. The incentive was not used to bias or drive a particular response, nor was the incentive contingent on a positive endorsement. More Info