Allstacks vs. Hatica

Overview
ProductRatingMost Used ByProduct SummaryStarting Price
Allstacks
Score 8.4 out of 10
N/A
Allstacks uses machine learning models to analyze SDLC data for delivery risks and projected outcomes for engineering leaders. The value stream intelligence platform illuminates insights across projects and tools so users can build better processes, create a better culture, and shape better outcomes for a business and its customers. Allstacks gathers and analyzes past work data and behavior from the tools a team is already using, like Jira, GitHub, and Bitbucket. The vendor states…N/A
Hatica
Score 9.4 out of 10
N/A
Hatica equips engineering teams with work visibility dashboards, actionable insights and workflows to drive team productivity and engagement in remote and in-office environments alike. The vendor offers a free forever plan to help get started. Features: Engineering metrics dashboards 100+ metrics from 20+ apps including Github, Jira, Slack, Zoom, Google Workplace Remote work insights Aggregated work overview, sprint and retro…N/A
Pricing
AllstacksHatica
Editions & Modules
No answers on this topic
Offerings
Pricing Offerings
AllstacksHatica
Free Trial
YesYes
Free/Freemium Version
NoYes
Premium Consulting/Integration Services
NoNo
Entry-level Setup FeeNo setup feeOptional
Additional Details
More Pricing Information
Community Pulse
AllstacksHatica
Best Alternatives
AllstacksHatica
Small Businesses
GitLab
GitLab
Score 8.7 out of 10
GitLab
GitLab
Score 8.7 out of 10
Medium-sized Companies
GitLab
GitLab
Score 8.7 out of 10
GitLab
GitLab
Score 8.7 out of 10
Enterprises
GitLab
GitLab
Score 8.7 out of 10
GitLab
GitLab
Score 8.7 out of 10
All AlternativesView all alternativesView all alternatives
User Ratings
AllstacksHatica
Likelihood to Recommend
8.4
(0 ratings)
9.4
(0 ratings)
User Testimonials
AllstacksHatica
Likelihood to Recommend
Our teams are now well equipped to communicate to the management with more transparency and clarity. All teams have improved their conversations. Managers are able to monitor the teams real time KPIs and identify any concerns immediately. We have been able to avoid many timeline delays. we do not miss any areas in our processes as we did before. The "helicopter" view on the entire process is highly valued.
Read full review
Engineering team management can be done better if we use metrics and the SPACE metrics are the best in that aspect. This product follows that research to deliver great analytics for team management. We also really like that the support is very hands-on, integration happened without any glitches and works well with our stack
Read full review
Pros
  • Team efficiency matrix tracking.
  • Track the progress of test cases.
  • Allocate excess resources if needed.
Read full review
  • Great visibility
  • Fewer risks, so better schedule management
  • Historical data is present so we're able to see how we're progressing
Read full review
Cons
  • UI can be rigid but is constantly improving
  • User Management is the biggest opportunity for improvement
Read full review
  • There are so many metrics that you’re able to measure - it can get overwhelming at first
  • We had a walkthrough session with the founder that helped us approach the platform with more confidence so maybe they can include help documents for first-time users
Read full review
Alternatives Considered
The detailed metrics which are shown when a software is deployed using pipeline is one of the greatest feature which overpowers GitLab.It has a very simple UI which allows easier creation of pipeline with all the required stages.
Read full review
No answers on this topic
Return on Investment
  • It's painful that jira items don't automatically get pulled in to allstacks
  • Would be great to have the data refresh a little more frequent
Read full review
  • Better team management because we can avoid blockers and help the tech team to work seamlessly
Read full review
ScreenShots

Allstacks Screenshots

Screenshot of

Hatica Screenshots

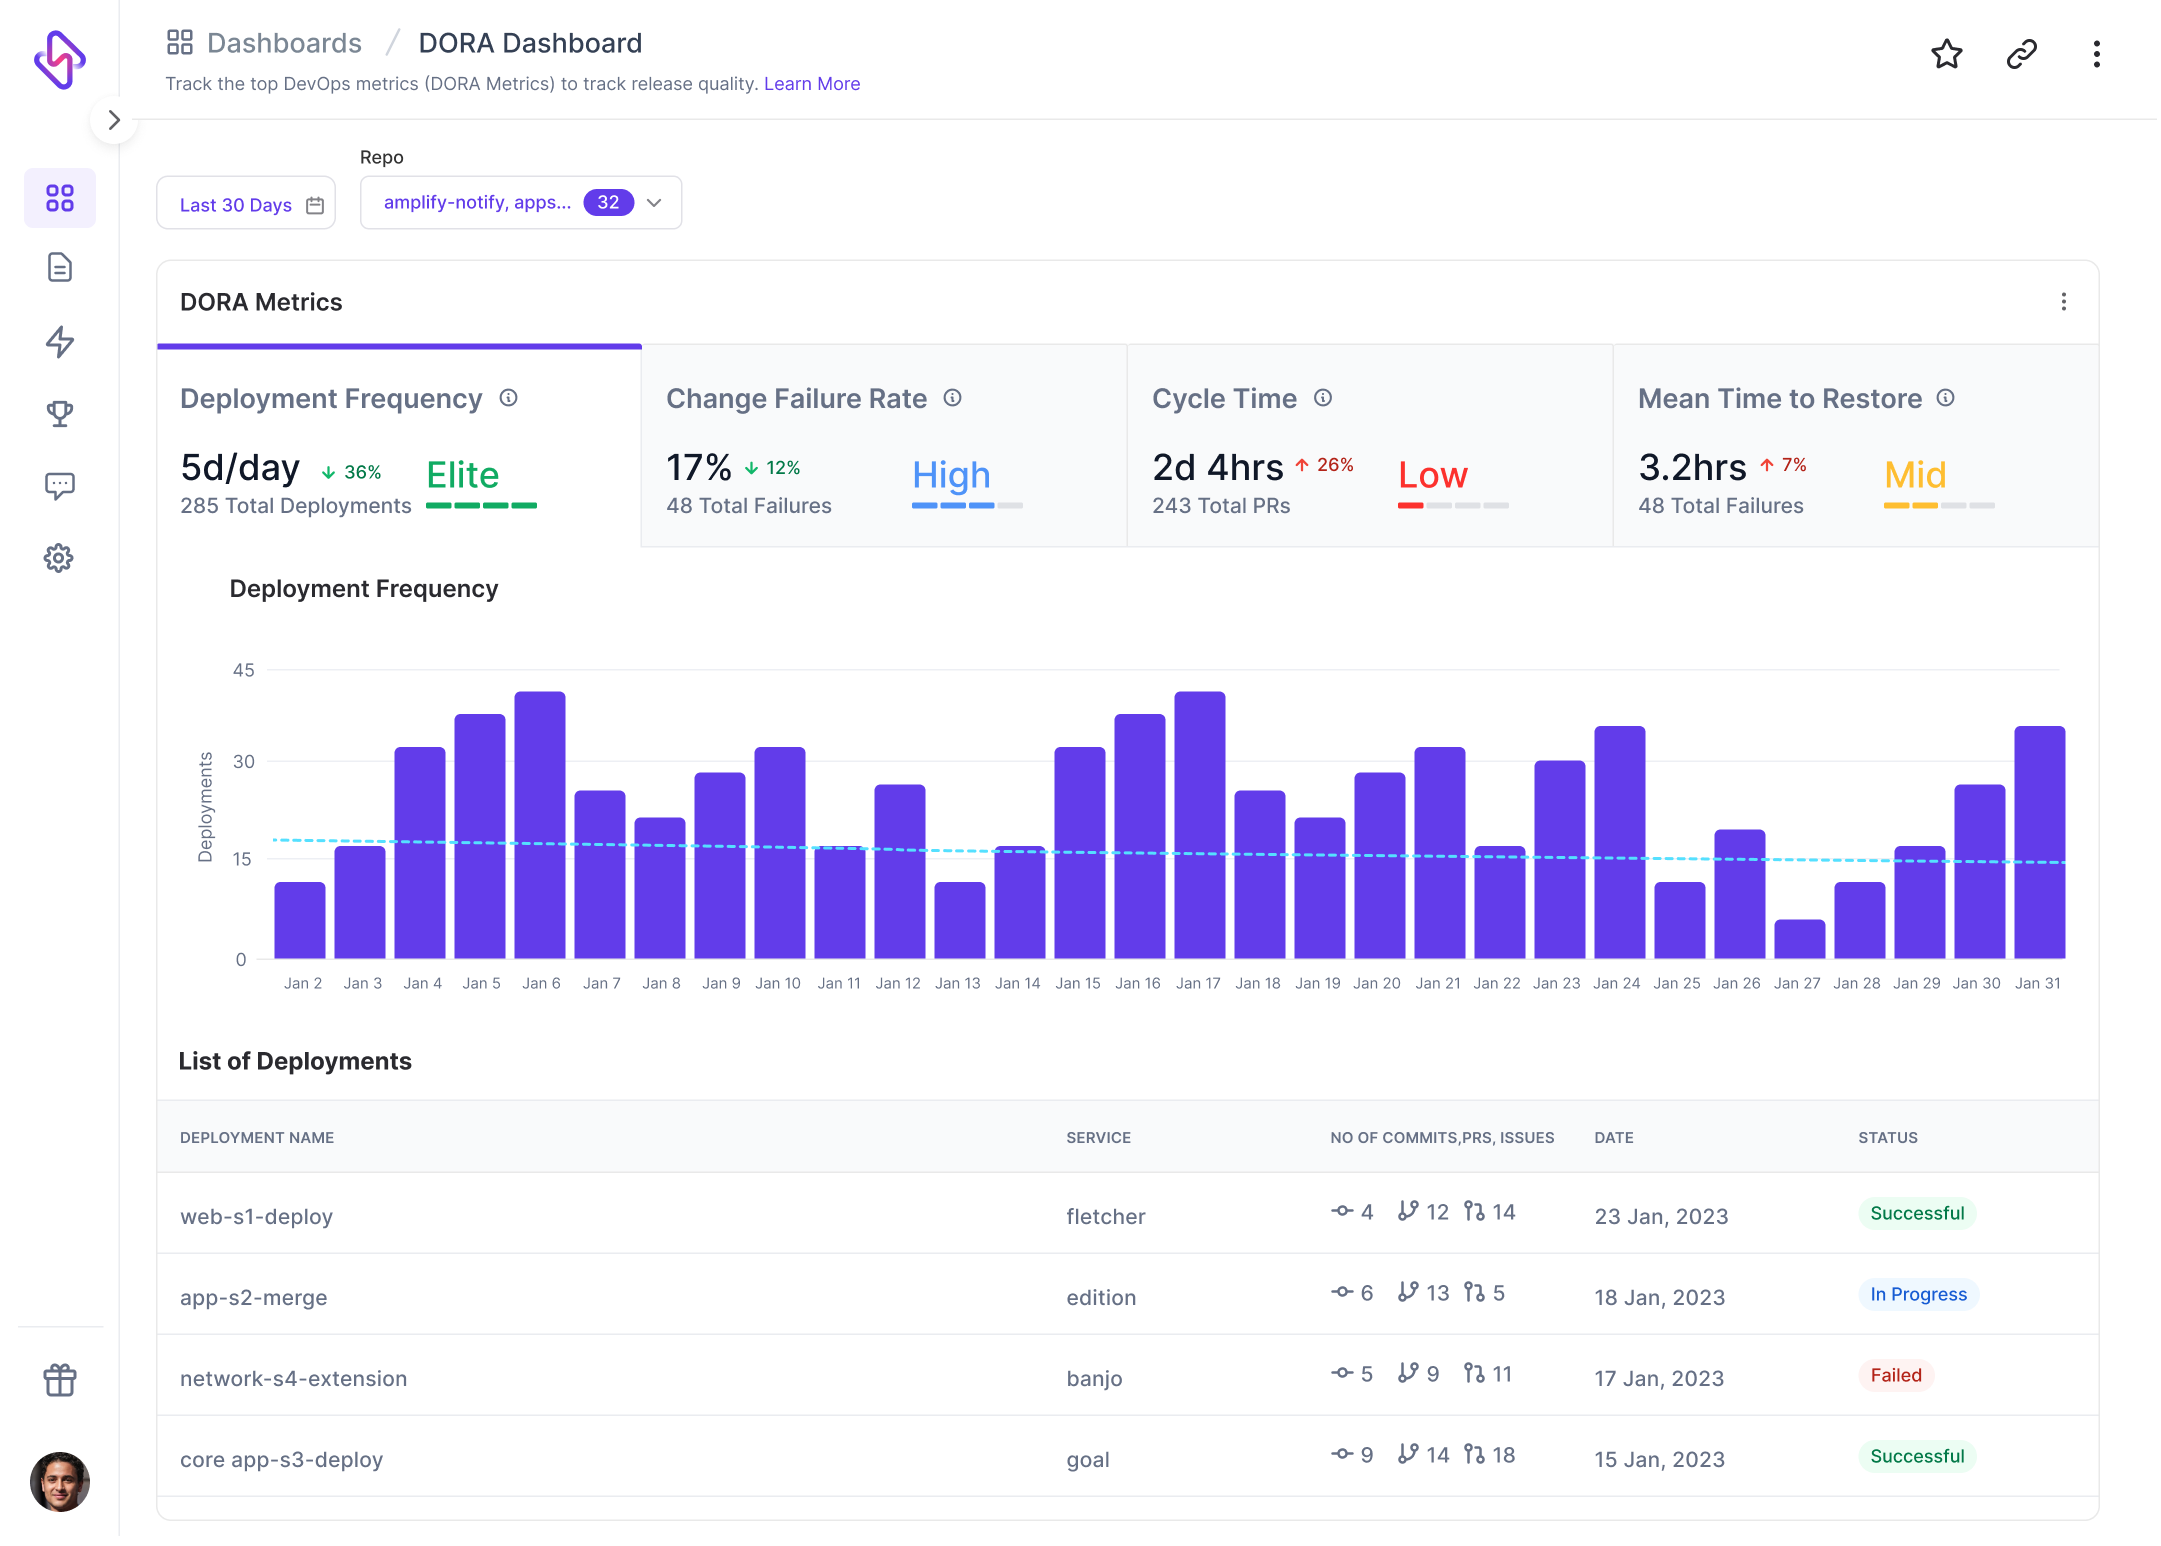
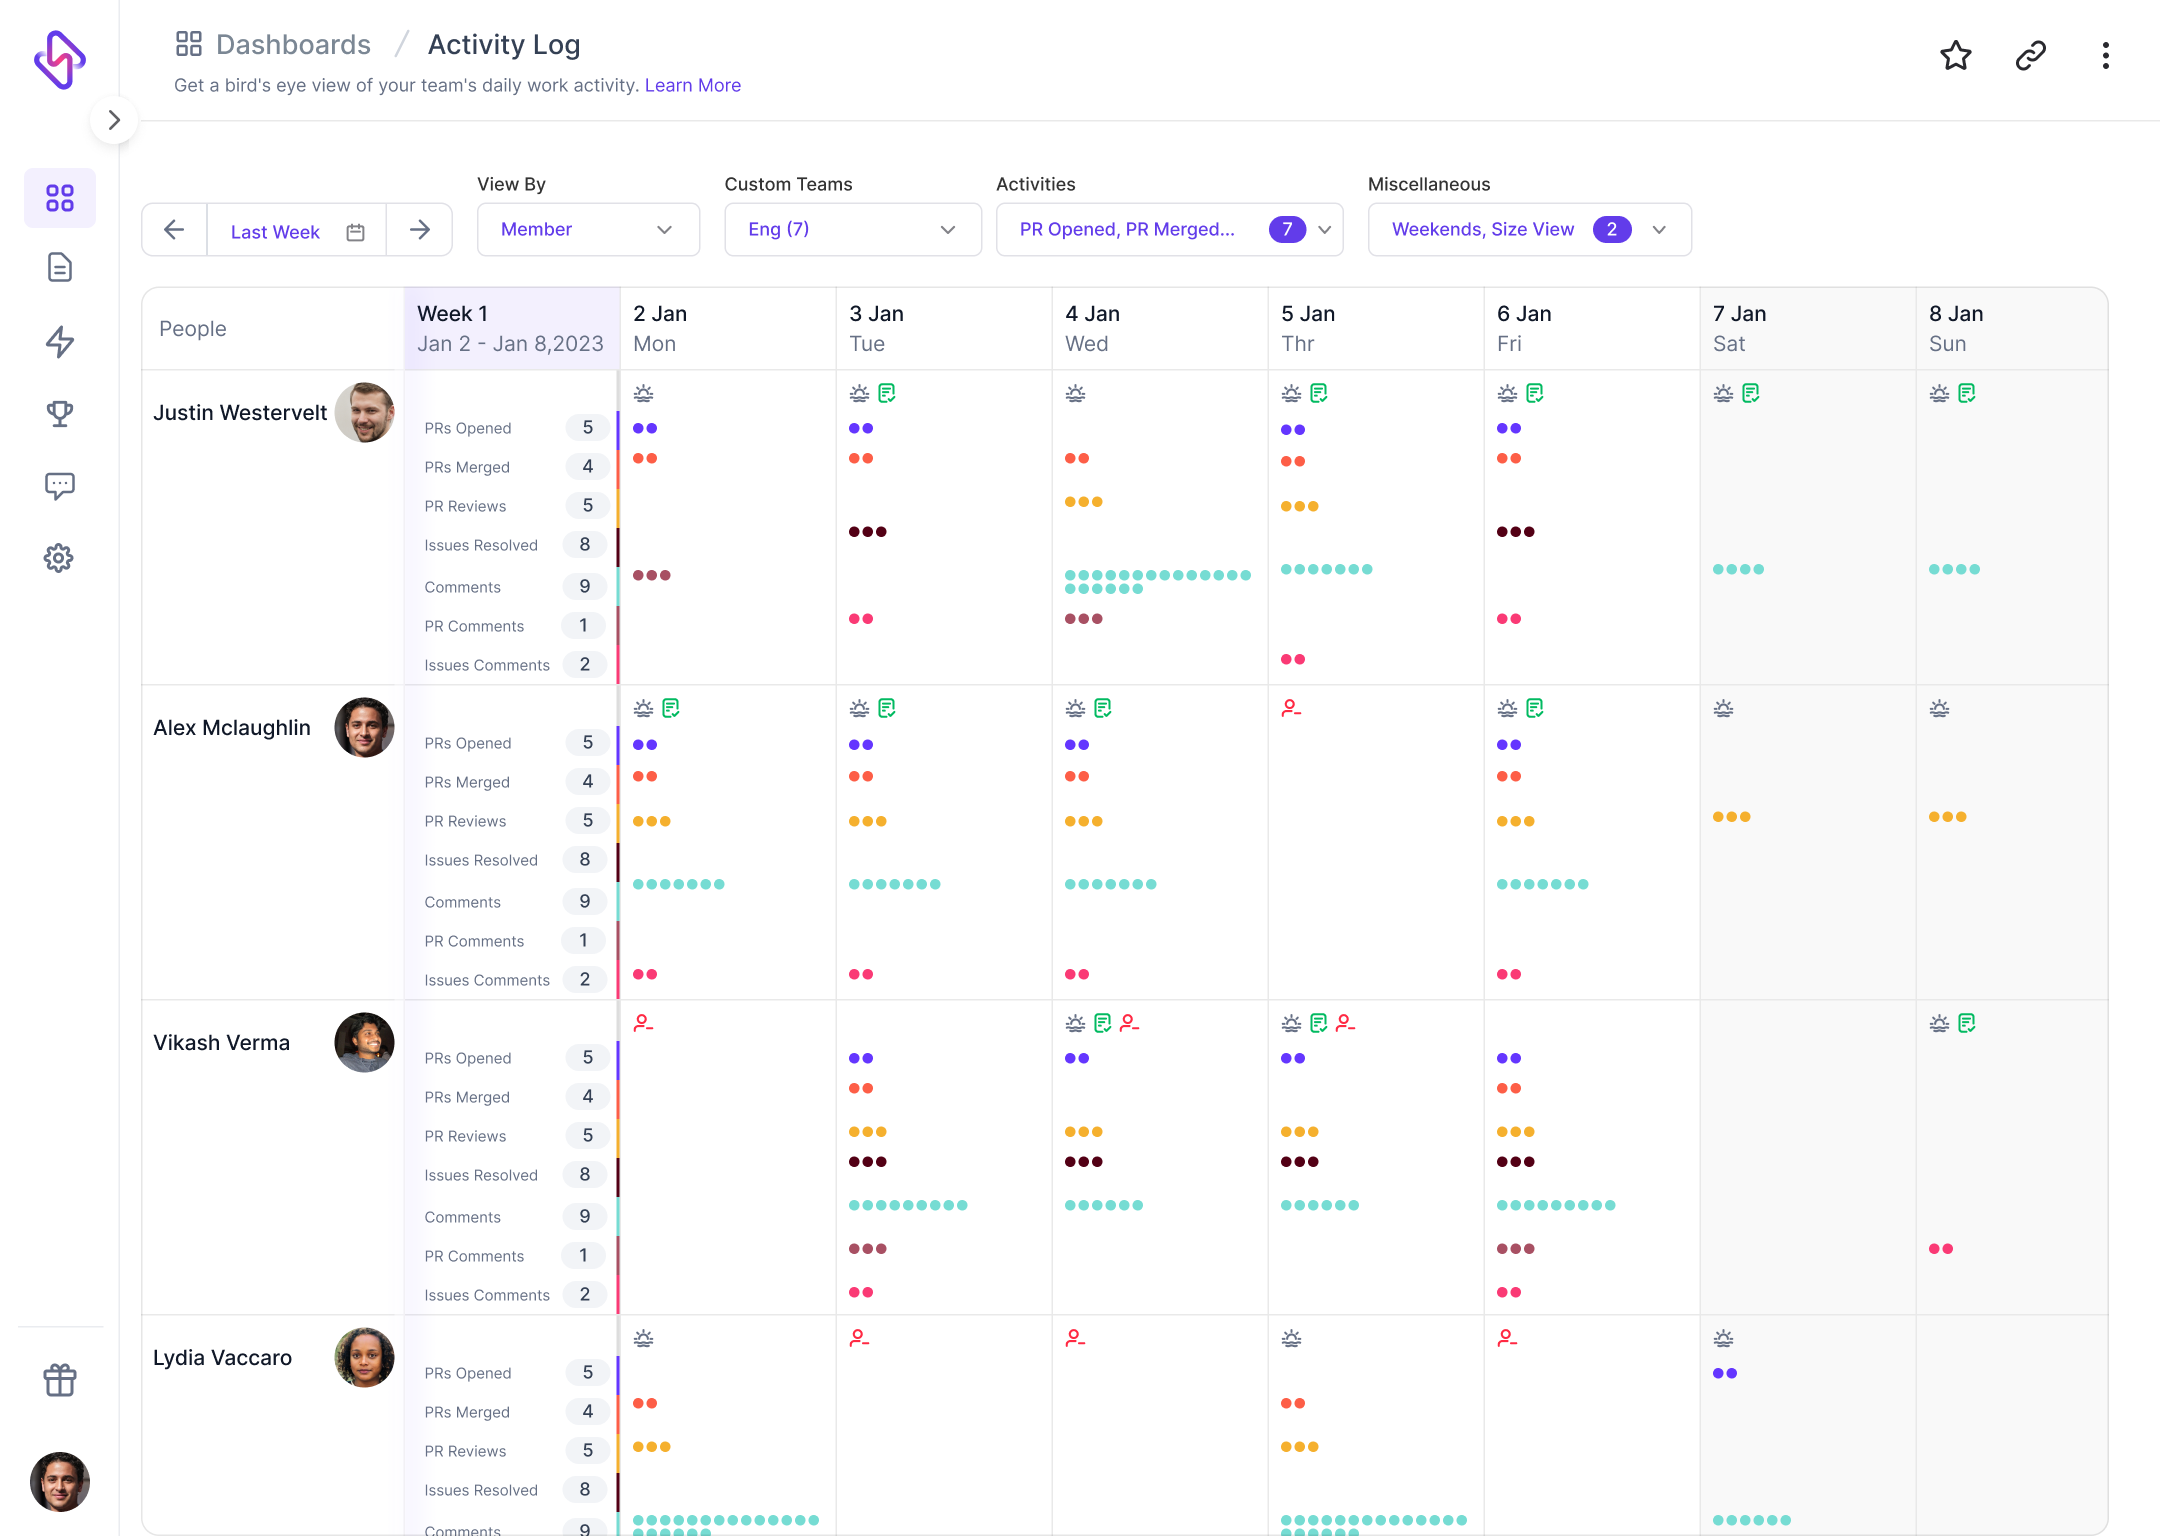
Screenshot of Code cycle time dashboard: Used to track and measure first commit-to-deployment cycle time to identify trends, bottlenecks, and pain points.Screenshot of Team Well-being: Offers insight into team well-being metrics like focus time, meeting time (and its breakdown), and other metrics.Screenshot of Resource Allocation: Provides insight into data and trends around how business strategy translates into engineering work.Screenshot of DORA: Helps to understand DevOps' release velocity and quality.Screenshot of Project Delivery Dashboard: Reveals sprint-over-sprint trends around sprint health, planning and delivery, importance of work, and work allocation.Screenshot of Activity Log: Calendarized view to help visualize work actions, spot trends in unbalanced workload, and be less hands-on.