Adobe acquired Omniture in 2009 and re-branded the platform as SiteCatalyst. It is now part of Adobe Marketing Cloud along with other products such as social marketing, test and targeting, and tag management.
SiteCatalyst is one of the leading vendors in the web analytics category and is particularly strong in combining web analytics with other digital marketing capabilities like audience management and data management.
Adobe Analytics also includes predictive marketing capabilities that help…
N/A
Chartbeat
Score6.9 out of 10
N/A
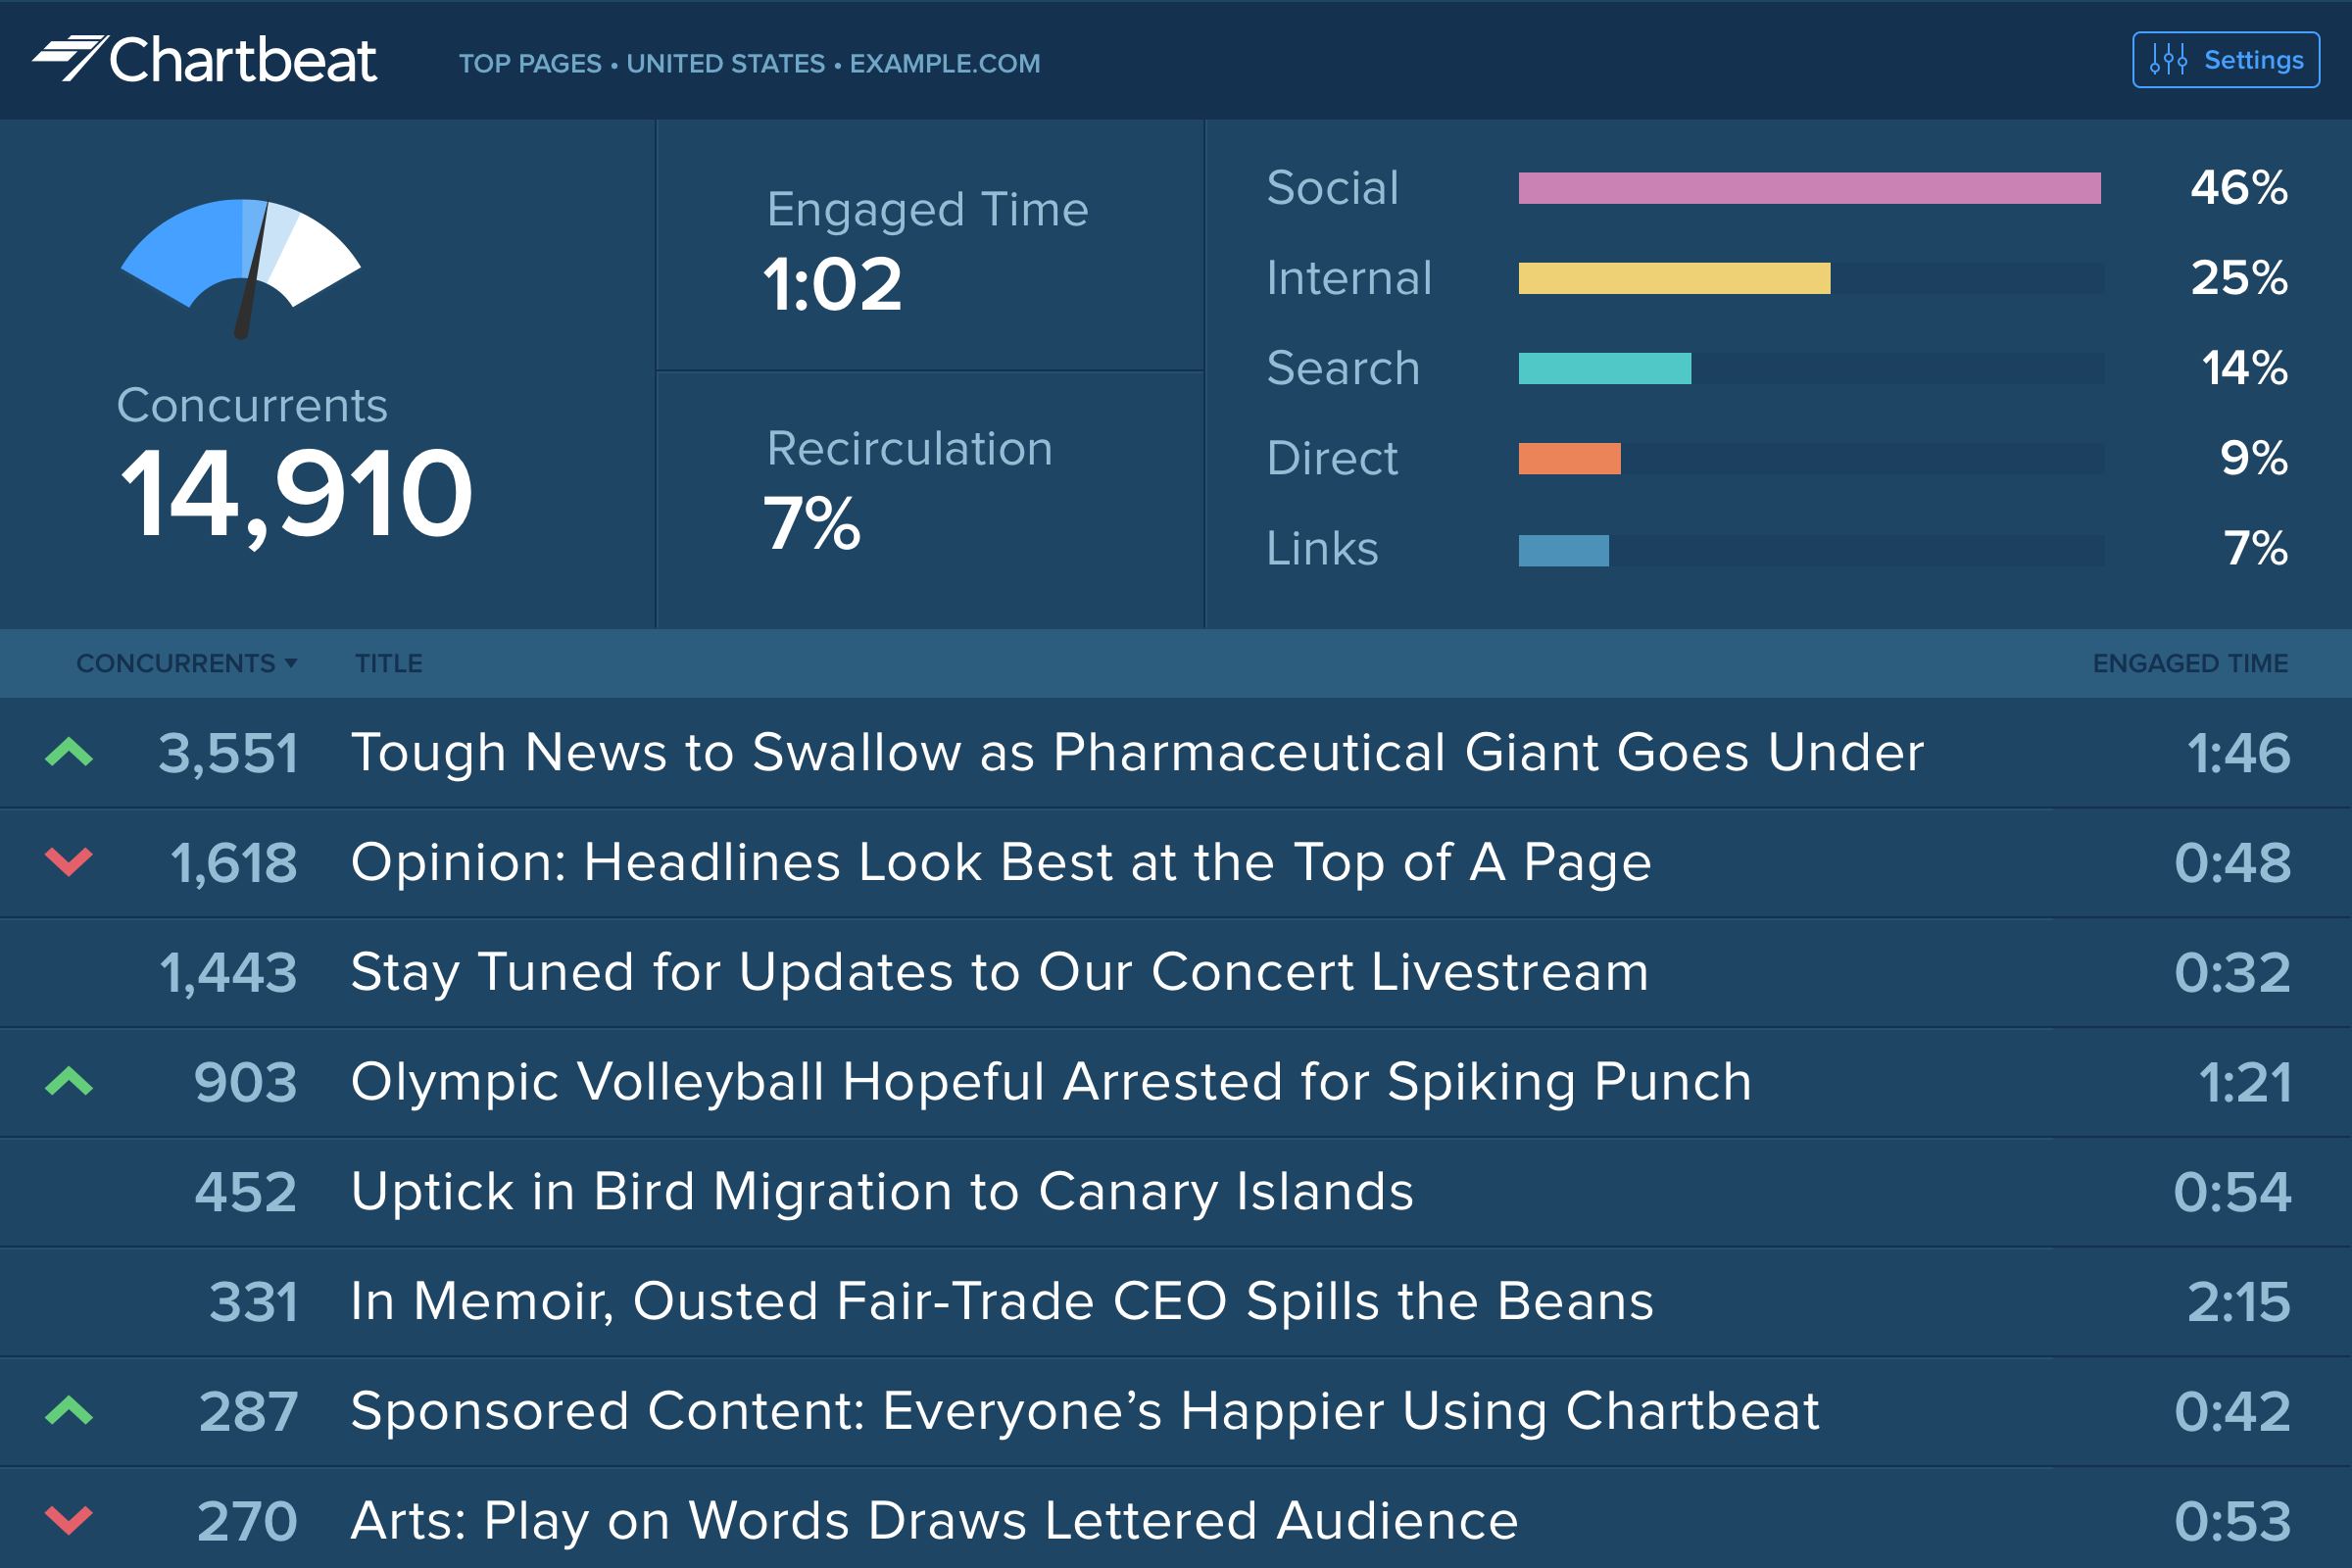
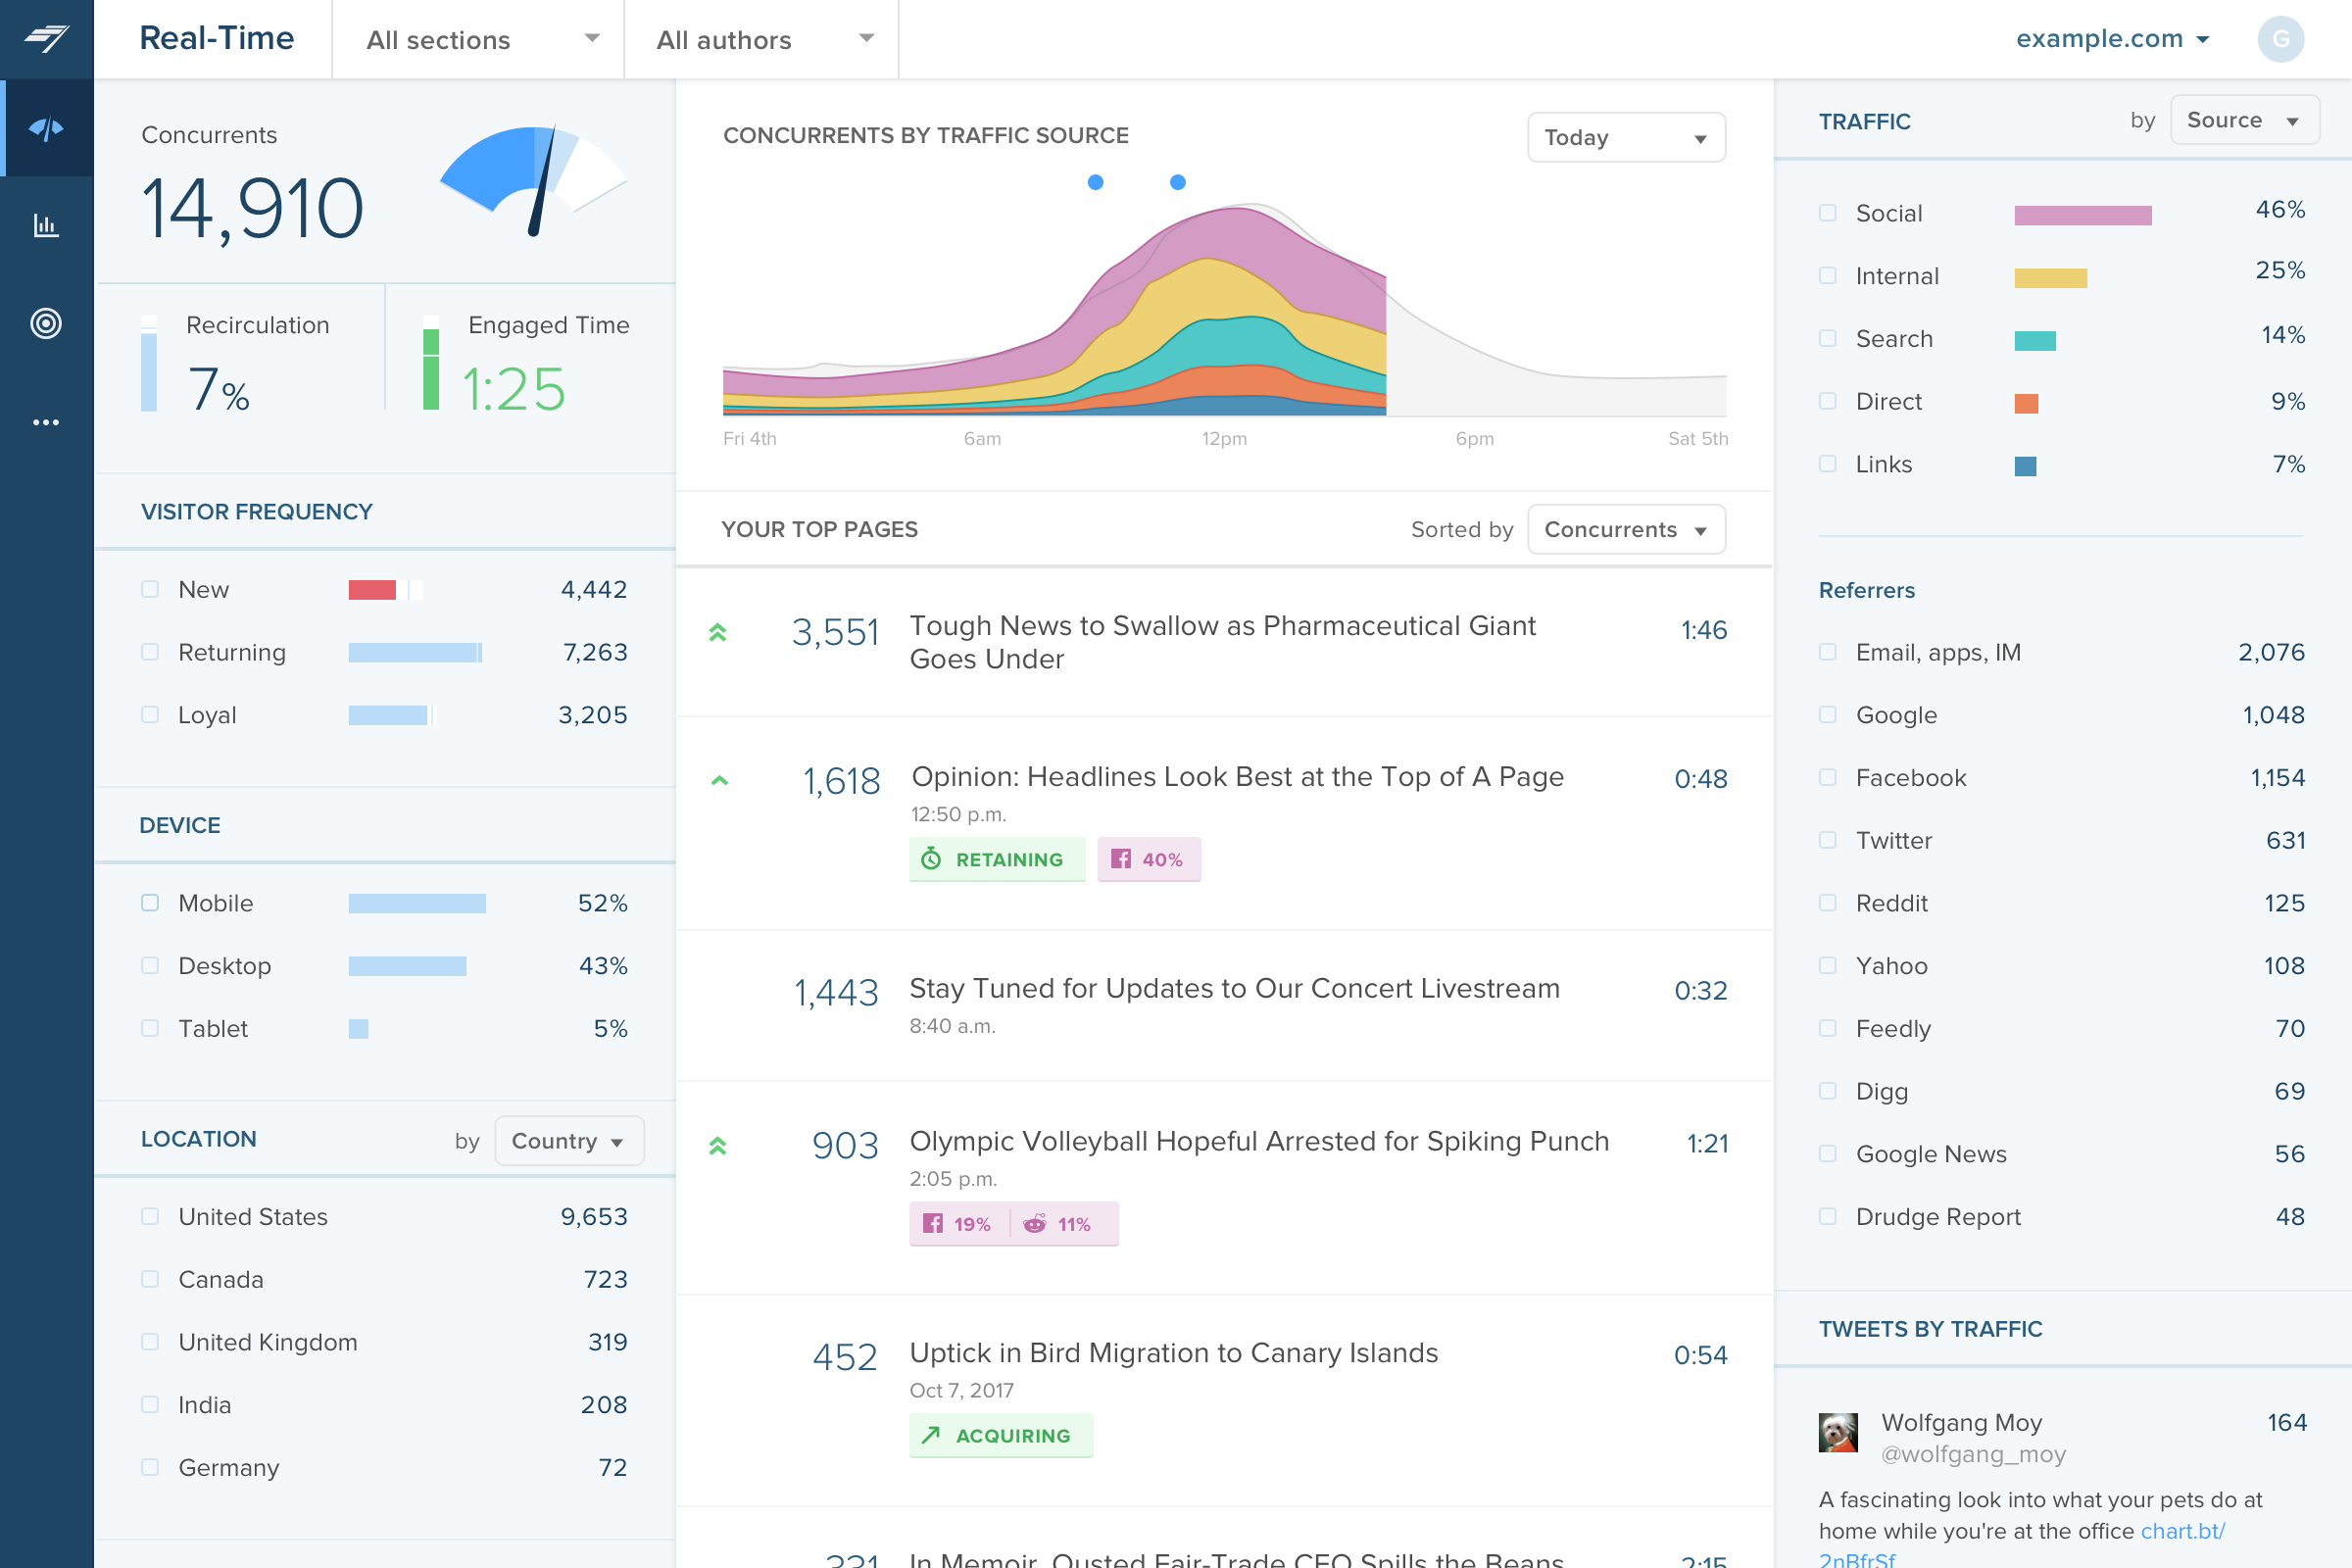
Chartbeat delivers real-time analytics, insights, and transformative tools for content teams around the world, to help improve audience engagement, inform editorial decisions, and increase loyalty.
N/A
Pricing
Adobe Analytics
Chartbeat
Editions & Modules
No answers on this topic
No answers on this topic
Offerings
Pricing Offerings
Adobe Analytics
Chartbeat
Free Trial
No
Yes
Free/Freemium Version
No
No
Premium Consulting/Integration Services
Yes
Yes
Entry-level Setup Fee
Optional
No setup fee
Additional Details
—
Chartbeat pricing is based on monthly site page views. Discounts are applied to multi-year contracts. The Basic Plan includes the Real-time Dashboard, Historical Dashboard, Heads Up Display, Reports, Big Board, iOS and Android app, and Real-time API endpoints.
The Plus Plan includes all of the Basic Plan features, plus ONE of the following Premium features: Headline Testing, Advanced Queries, or Multi-Site View.
The Premium Plan includes all of the Basic Plan features, plus ALL Premium features: Headline Testing, Advanced Queries, Multi-Site View, and enterprise-level support and custom trainings.
More Pricing Information
Community Pulse
Adobe Analytics
Chartbeat
Considered Both Products
Adobe
Verified User
Chose Adobe Analytics
Adobe Analytics allows for the comparison of the same metric with and without various segments applied. Google Analytics is an all-or-nothing situation; either you apply a segment to metric or you do not. This makes it difficult for segment vs. non-segment and creating …
A de minimis incentive was given to thank the reviewer for their time. The incentive was not used to bias or drive a particular response, nor was the incentive contingent on a positive endorsement. TR verified that a representative sample of customers was invited. More Info
A de minimis incentive was given to thank the reviewer for their time. The incentive was not used to bias or drive a particular response, nor was the incentive contingent on a positive endorsement. More Info
Digital Analyst at Bonnier Corporation (Publishing, 501-1000 employees)
Chose Adobe Analytics
From its original namesake (Omniture), the strength of the brand was a big factor. Also the idea of having dedicated support staff 24/7. More visually appealing. More custom tools (Analysis Workspace, Discover, Report Builder).
A de minimis incentive was given to thank the reviewer for their time. The incentive was not used to bias or drive a particular response, nor was the incentive contingent on a positive endorsement. More Info
Director of Product Management & Marketing in Marketing at Olive Software (Computer Software, 51-200 employees)
Chose Adobe Analytics
Adobe Analytics (previously known as Omniture) is the de-facto standard across the media industry. Google has very quickly caught up with Adobe and it is always worthwhile to take a very long look at Google Analytics to evaluate the differences. Your decision will depend on …
A de minimis incentive was given to thank the reviewer for their time. The incentive was not used to bias or drive a particular response, nor was the incentive contingent on a positive endorsement. More Info
Chartbeat
Verified User
Chose Chartbeat
We use Chartbeat in conjuction with these tools. Chartbeat is forward facing and we encourage everyone in the newsroom to use it. It provides the best live view, but lacks depth needed for more longer-term trend reporting and analysis. Domo allows much more advanced data …
A de minimis incentive was given to thank the reviewer for their time. The incentive was not used to bias or drive a particular response, nor was the incentive contingent on a positive endorsement. More Info
Verified User
Chose Chartbeat
We use Chartbeat for real-time evaluation and Adobe Analytics for longer-term performance reporting. Chartbeat is easier to use overall, particularly for content producers. Researchers tend to rely on Adobe Analytics for their reports. We have found that we need to keep using …
A de minimis incentive was given to thank the reviewer for their time. The incentive was not used to bias or drive a particular response, nor was the incentive contingent on a positive endorsement. More Info
Verified User
Chose Chartbeat
Chartbeat is better for live metrics than either Adobe or Google, but Adobe Omniture especially is much better for tracking historic numbers.
A de minimis incentive was given to thank the reviewer for their time. The incentive was not used to bias or drive a particular response, nor was the incentive contingent on a positive endorsement. TR verified that a representative sample of customers was invited. More Info
Verified User
Chose Chartbeat
Omniture gives more detailed analytics to look at trends and diagnostics over a span of time. Chartbeat is better for real time to assess what is going on right now.
Verified User
Chose Chartbeat
Chartbeat is certainly better at visualizing content and segmenting the data all on one screen. We can filter by section, author, channel and more without leaving the main dashboard page. Combining properties together in roll up groups is another key feature. We're able to …
A de minimis incentive was given to thank the reviewer for their time. The incentive was not used to bias or drive a particular response, nor was the incentive contingent on a positive endorsement. TR verified that a representative sample of customers was invited. More Info
Director at Tribune Publishing (Newspapers, 1001-5000 employees)
Chose Chartbeat
Chartbeat really remains the gold standard in the tracking, measurement and display of realtime engagement metrics. If your site has sufficient audience benefit from immediate changes in content programming, display and design, it's a great tool with a highly refined and …
A de minimis incentive was given to thank the reviewer for their time. The incentive was not used to bias or drive a particular response, nor was the incentive contingent on a positive endorsement. More Info
Verified User
Chose Chartbeat
Simpler, more effective, real-time tool with broader accessibility for team
A de minimis incentive was given to thank the reviewer for their time. The incentive was not used to bias or drive a particular response, nor was the incentive contingent on a positive endorsement. More Info
Verified User
Chose Chartbeat
Chartbeat is great because it gives you numbers fast. It can be left up on a screen all day and not touched and will still give you facts that you want or need about how many people are on the website at a given time. It is reliable and very easy to understand.
A de minimis incentive was given to thank the reviewer for their time. The incentive was not used to bias or drive a particular response, nor was the incentive contingent on a positive endorsement. More Info
Maybe for a small company with small products for their thing, Adobe may be bit of an implementation too much for them, but when it comes to companies like us, like a life sciences or large enterprises and even small enterprises, but with more products, more analysis that they need to make their marketing experience better, maybe Adobe product is the best suitable.
A de minimis incentive was given to thank the reviewer for their time. The incentive was not used to bias or drive a particular response, nor was the incentive contingent on a positive endorsement. TR verified that a representative sample of customers was invited. More Info
The main point of benefit is the realtime data. This is vital to our team as we are publishing a lot of content per day, so we have a busy homepage to manage and it's important to know which content is performing well. We also like to get an understanding as quickly as possible - which Chartbeat offers - of where traffic is coming from. Often we will see an example where a page is getting high traffic from Google, for example, and we know that might not need to be placed so prominently on the homepage because the traffic is arriving to us externally anyway. Without that depth of understanding what is performing best and why - updated immediately, unlike in Google Analytics now - our homepage would not be as well optimised for users coming to us direct
A de minimis incentive was given to thank the reviewer for their time. The incentive was not used to bias or drive a particular response, nor was the incentive contingent on a positive endorsement. More Info
It summarizes large complex data better than any other analytics solution I've dealt with without the need for sampling, gives the right level of detail, does the right level of breakdowns, aggregation. I consistently not only use Adobe Analytics, but I use other data sets and compare against Adobe Analytics. And as I go into Adobe Analytics and compare, as long as I've done the query right and the other systems, they're very, very close. And if anything, with a lot of Adobe's newer products, they've gotten more accurate over time. So that's basically, you asked me what I liked about it. I like that it's accurate. I like that I don't have to do a lot of explaining. There's enough explaining in the world of web analytics to have to go back and explain why data's problematic. And so like I said, provided that the implementation is correct, it's a very easy conversation. Even if people may not like the answer.
A de minimis incentive was given to thank the reviewer for their time. The incentive was not used to bias or drive a particular response, nor was the incentive contingent on a positive endorsement. TR verified that a representative sample of customers was invited. More Info
Support. I mentioned this earlier and we don't know what we don't know. Researching the massive amounts of documentation isn't realistic with bandwidth constraints, and our rep getting frustrated with us when we go through what we are seeing is disappointing.
Education. More please, and designed more towards the "business side". I get with the many many many different implementations (every company is different!), that it's tough, but even a basic of the basics would be nice for situations that everyone is looking at, like the engagement with the merchandising on the home page (or any certain page).
A de minimis incentive was given to thank the reviewer for their time. The incentive was not used to bias or drive a particular response, nor was the incentive contingent on a positive endorsement. TR verified that a representative sample of customers was invited. More Info
Source of traffic needs improvement. Search and social make sense, but "internal" and "links" is a grey area. It would be helpful to define those with an organization and provide an information icon so users can easily remember what each of those buckets is tracking.
More ways to customize the real-time board. For example, with video content, that's great that I can see a user has started a video, but what is the completion rate, was that only on O&O or can that track Facebook, too?
Would like to see demo (age) information included as a way to slice the data so I can see what's working with my older and younger demo.
A de minimis incentive was given to thank the reviewer for their time. The incentive was not used to bias or drive a particular response, nor was the incentive contingent on a positive endorsement. TR verified that a representative sample of customers was invited. More Info
We've found multiple uses for Adobe Analytics in our organization. Each department analyzes the data they need and creates actionables based off of that data. For E-Commerce, we're constantly using data to analyze user engagement, website performance and evaluate ROI.
A de minimis incentive was given to thank the reviewer for their time. The incentive was not used to bias or drive a particular response, nor was the incentive contingent on a positive endorsement. More Info
I gave Chartbeat a 5 for a renewal rating, because, while it delivers clear and understandable content, Google Analytics also provides many of the same features for free. For a small to medium website, I believe it would be more cost effective to use Google Analytics. A website with a high amount of traffic, however, could merit spending the money on Chartbeat to maximize their potential.
Sometimes the processing times are very long. I have had reports or dashboards time out multiple times during presentations. It could be improved. It is understandable since there is a huge data set that the tool is processing before showing anything, however for a company that large they should invest in optimizing processing times.
A de minimis incentive was given to thank the reviewer for their time. The incentive was not used to bias or drive a particular response, nor was the incentive contingent on a positive endorsement. More Info
I am able to "set it and forget it," keeping it up on my monitor for either constant checking or just keeping an eye on the numbers during the day. I'm also able to keep track of what times are perfect to post a story and which stories rack up the most traffic.
A de minimis incentive was given to thank the reviewer for their time. The incentive was not used to bias or drive a particular response, nor was the incentive contingent on a positive endorsement. More Info
I do not ever recall a time when Adobe Analytics was unavailable to me to use in the 8 or so years I have been an end user of the product. My most-used day-to-day analytics tool Parse.ly however, generally has a multiple hours planned offline maintenance every two to four weeks, and sometimes has issues collecting realtime analytics that last anywhere between 15 minutes to an hour, and happen anywhere between 1 to 5 times a month.
A de minimis incentive was given to thank the reviewer for their time. The incentive was not used to bias or drive a particular response, nor was the incentive contingent on a positive endorsement. TR verified that a representative sample of customers was invited. More Info
Again, no issues here. Performance within the day updates hourly. other reports are updated overnight and available to access by the next morning. Pages load quickly, the site navigates easily and the UX is quite straightforward to get command over. On this front, I give Adobe kudos for building a great experience to work within
A de minimis incentive was given to thank the reviewer for their time. The incentive was not used to bias or drive a particular response, nor was the incentive contingent on a positive endorsement. More Info
I barely see any communication from Adobe Analytics. The content on the web is also not that great or easy to read. I would recommend a better communication about the product and the new addons information to come to its user by a better mean.
I have had limited experience of support for Chartbeat but whenever I have needed help it has been there. Recently there was an issue of seeing different forms of data in real time - app and otherwise effectively, and the issue was being clearly dealt with and communicated back to us.
A de minimis incentive was given to thank the reviewer for their time. The incentive was not used to bias or drive a particular response, nor was the incentive contingent on a positive endorsement. More Info
It was a one-day training several years ago that cost the organization several thousand dollars. There were only about 10 people in the training class. Adobe tried to cram so much information into that one-day class that none of our users felt like they really learned anything helpful from the experience. Follow-up training is too expensive
The online training for Adobe SiteCatalyst consists of short product videos. These are ok, but only go so far. For a while Adobe charged a fee for this, but recently made these available for free. There are many great blog posts that help users learn how to apply the product as well.
One of the benefits and obstacles to successfully using Adobe Analytics is a great / more accurate implementation, make sure your analytics group is intimate with the details of the implementation and that the requirements are driven by the business.
Google Analytics comes across more of a reporting tool whereas Adobe Analytics is more of an Enterprise level analytics tool. Contentsquare provides some traffic and flow capabilities but not to the same level as Adobe Analytics. However, Contentsquare's major advantage is its Zoning (Heatmapping), Impact Quantification and Find 'n' Fix modules; none of which are knowingly available in Adobe Analytics.
A de minimis incentive was given to thank the reviewer for their time. The incentive was not used to bias or drive a particular response, nor was the incentive contingent on a positive endorsement. More Info
Omnilytics is more robust, detailed, and catered for an intermediate media user, while I think Chartbeat is a more user-friendly and beginner-oriented piece of technology. That being said, there is an impressive amount of lift for Chartbeat, and it's evident that simplicity is the key to using a software daily (which is absolutely the point in the content world).
A de minimis incentive was given to thank the reviewer for their time. The incentive was not used to bias or drive a particular response, nor was the incentive contingent on a positive endorsement. More Info
Adobe Analytics is relatively affordable compared to other tools, given it provides a range of flexible variables to use that I have not found in any other tools so far. It is worth investing in if your company is medium or large-sized and brings a steady flow of revenue. For small companies, it can be overpriced.
A de minimis incentive was given to thank the reviewer for their time. The incentive was not used to bias or drive a particular response, nor was the incentive contingent on a positive endorsement. More Info
My organization uses Adobe Analytics across a multitude of brand portfolios. Each brand has multiple websites, mobile apps and some even have connected TV apps/channels on Roku and similar devices. Adobe can handle the multitude of properties that have simple, small(ish) websites and the larger brand properties that include web, mobile and connected TVs/OTT devices.
Each of those larger brands has multiple categories and channels to keep track of. We can see the data by channel/device or aggregate all the data together. This gives our executive teams the full picture and the departmental teams the view they need to see their own performance.
A de minimis incentive was given to thank the reviewer for their time. The incentive was not used to bias or drive a particular response, nor was the incentive contingent on a positive endorsement. TR verified that a representative sample of customers was invited. More Info
The professional services team is one of the best teams for complex adobe analytics implementations, especially for clients having multiple website and mobile applications. However, the cost of professional services is a bit high which makes few clients opt out of it, but for large scale implementations they are very helpful
A de minimis incentive was given to thank the reviewer for their time. The incentive was not used to bias or drive a particular response, nor was the incentive contingent on a positive endorsement. More Info
Adobe Analytics impacts nearly every aspect of a billion plus dollar revenue eCommerce business. From measuring the impact of new build features to marketing campaigns.
We are saving substantial money and resource effort by consolidating all of our properties to Adobe Analytics from alternative solutions, at which point we will finally be able to report on Total Digital, rather than disparate reports.
We support experimentation on every platform and the performance is only known through Adobe Analytics tagging.
A de minimis incentive was given to thank the reviewer for their time. The incentive was not used to bias or drive a particular response, nor was the incentive contingent on a positive endorsement. TR verified that a representative sample of customers was invited. More Info
A de minimis incentive was given to thank the reviewer for their time. The incentive was not used to bias or drive a particular response, nor was the incentive contingent on a positive endorsement. More Info